


Brokered Patent Market Report Summarized – GreyB
A notable trend observed in the Patent Brokered Market Report 2022 is the exit of big companies from the markets and the subsequent listing of their assets. For instance, GoPro Inc. is selling its drone portfolio, and Intel Corp is selling its wireless portfolio.
This can be attributed to the economic downturn, which encourages operating companies to sell assets, leading to growth in the patent market.
This year’s exhaustive patent broker market report by Richardson Oliver Insights highlights significant changes in the patent market.
- Operating companies are selling more assets than NPEs. As a result, the market witnessed a shift in the ownership of assets from operating companies to NPEs. In this context, a proactive approach towards cross-licensing will be crucial in mitigating risks.
- In previous ROI reports, it was shown that the number of brokers in the market was declining. However, this report reveals the opposite when considering the broader broker community.
- While software-related patents still dominate the market, there has been a significant increase in hardware packages.
Overall, this year’s ROI report is more transparent and provides precise details about market behavior. Looking at the flow of patents in the market gives a better understanding of the market, from their initial offering to sale and beyond.
So, without further delay, let’s dive right in!
Market Size
The total asking price of the 250,000 assets tracked by ROI in 2022 is $14.7 billion in asking price. This is $4.7 billion more than the sales in November 2021. Approximately $16 billion in sales were expected to be reached by the first quarter of 2024.
Patent Brokers
Previously, the ROI report 2021 stated that there has been a decline in the number of brokers in the market. While this is true for patent packages generally available to all buyers, it does not present the full picture. Therefore, when the report considers the larger broker community, there are more brokers than what was previously reported.
Brokers have accounted for over 90% of the packages sold in the last five years. Remarkably, brokers have played a significant role in the sale of assets.
Per the ROI Report, here is a list of brokers who brought five or more packages to the market in 2022.
| Adapt IP Ventures |
| Dynamic IP Deals LLC |
| G1 IP Law Firm |
| GTT Group |
| Huang Partners IP Advisory |
| ICAP |
| Iceberg |
| IP Approach, LLC |
| IP Offerings |
| IP Pioneer Group |
| IPInvestments Group |
| KangHan International Patent & Law Firm |
| N&G Consulting |
| OCEAN TOMO, LLC |
| Red Chalk Group |
| Reliance Capital |
Another metric reviewed by the brokered patent market report this year was the number of unique brokers closing deals in any calendar year. Unique brokers increased slightly from 55 in 2017 to 63 in 2022.
Explore the list of Patent Brokers from different countries here.
Packages
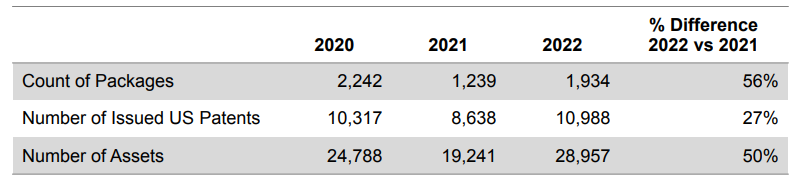
During 2021, the package count recovered from their all-time low in 2020 and reached 17%. In 2022, package and asset counts have significantly increased from the previous year. 2022 asset counts increased 50% from 2021 and exceeded even 2020’s counts, as seen in Table 1.
Table 1: Packages and assets listed by year.
Coming to the package bifurcation based on the technology, all categories saw increased package counts from 2021 to 2022.
Software-related technologies continue to dominate the patent market. But, the biggest increase was in hardware-related packages, which bagged the second spot after Software.
Figure 1: The report’s package distribution by technology group.
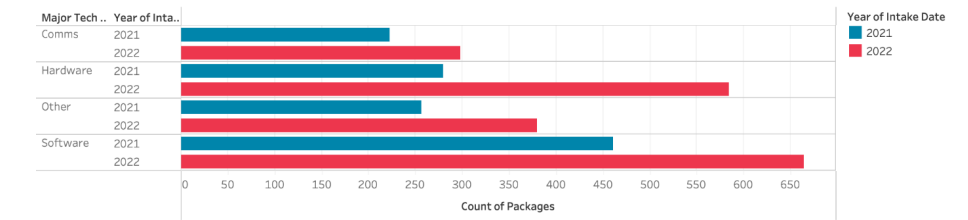
Source: ROI Brokered Patent Market 2022
In the patent broker market, the word ‘user’ was previously the most frequently used term, but in 2022, the word ‘cloud’ has taken over. By analyzing the word cloud, it can be deduced how the packages were marketed in 2022.
Unsurprisingly, major technology companies such as Google, Apple, and Microsoft are still the preferred targets in the Evidence Of Use (EOU) materials of patent sellers. The focus of products and technologies may change over time, but the focus of companies has remained the same.
Pricing
Over the years, pricing transparency has been a topic of constant debate as it benefits some while obstructing the market as a whole. Therefore, the most important thing to understand is that pricing is complex in every industry. An important aspect of price is that it is different than value – critically different.
For a patent to sell, the value of a patent to the seller must be less than the sales price.
Similarly, the value of a patent to the buyer must be greater than the purchase price. In 2022, the median asking price per asset dropped 30% from $143,000 to $100,000, the lowest price in the past five years.
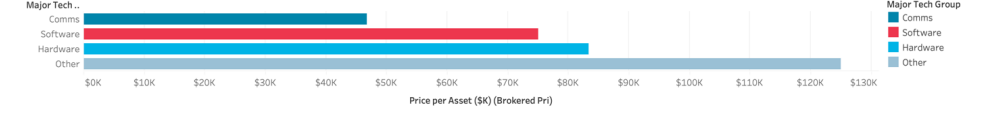
Regarding the highest asking prices by tech category, the ‘other’ packages, which include medical devices, automotive, and energy-related patents, have been consistently increasing in price and have become the most expensive in 2021. Surprisingly, the software has fallen below hardware for the first time since 2018.
Figure 2: Distribution of Asking Prices By Technology
Asking price and impact of EOU
The median and average asking pricing simply initiate the conversation on the starting price of a package. If a package should have a higher asking price, it depends upon the Evidence of Use or an infringement claim.
As per the report, the packages with EOU have stayed about the same (this year at 31%).
Sales
The ROI report excludes a package that recently entered the market from its analysis because it is not a reliable indicator of sales rates. Many of the packages are too new to have been sold, and therefore, the report does not consider that year.
Currently, packages first listed in 2017 are almost 30% sold. This means that even packages that have existed for a long time will eventually sell. One benefit for buyers is that old packages often have a high discount on the asking price. Keeping that in mind, the 2022 sales figures stand at 5%.
High discounts on the packages may seem an attractive option, but before making that buy – Perform the due diligence to assess the ROI of the older packages

Sellers
For a buyer, tracking the seller’s behavior, both in aggregate and individually, allows for operationalizing the buying activities. Knowing who is willing to sell and the type of assets available allows one to review listings faster and presents the opportunity to make a direct approach for a private deal.
The above holds true, especially for repeat sellers. These account for more than 40% of the transactions of packages in calendar years 2021 and 2022.
Additionally, Figure 3 below shows that, on average, 40% to more than 60% of the packages and assets came from operating companies. Considering that operating companies file most patents, this is not particularly surprising.
Figure 3: Distribution of seller type (Provenance Omitted)
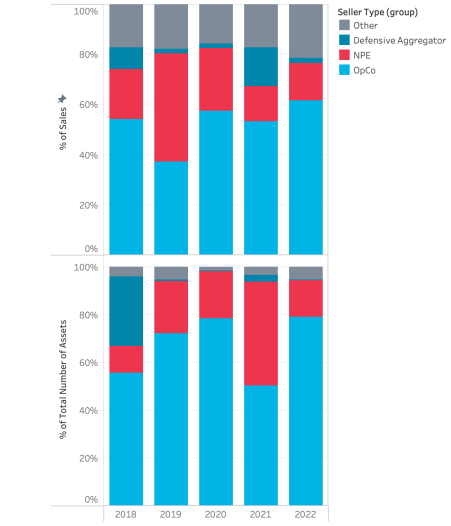
Source: ROI Brokered Patent Market
Buyers
Patent buyers consider patents to be an asset with significant potential benefits in the future. The acquired patents can mitigate potential risks, support new technology, counteract legal action by competitors, or earn money through licensing. In other words, the buyer is taking a calculated risk that the value of the patents they obtain will surpass the purchase price.
Furthermore, the buyer’s decision to buy a patent is based on the perceived value of the patent to them, which may differ from the value perceived by others.
Regarding the market analysis of sold packages, Richardson Oliver Insight’s patent market report shows that NPEs purchased an average of 25% to more than 50% of assets. Operating companies also bought a significant number of packages (24% to 48%), but they acquired more assets (44% to 67%).
It’s worth noting that operating companies sold more assets than NPEs, which means the patent market is seeing a shift of assets from operating companies to NPEs.
Litigation
A large pool of litigation risk is present in the brokered patent. Any package that is listed on the market for sale obviously means that the seller plans on monetizing it. When a patent is listed on the market for sale, the seller intends to profit from it. This creates a high level of risk for litigation. Patents sold to Non-Practicing Entities (NPEs) are particularly risky, but even if the patents don’t sell, there is a high chance of litigation.
Approximately 30% to 45% of packages sold to NPEs will result in at least one successful patent litigation lawsuit. For the market as a whole, more than 6% of listed packages are litigated after being put up for sale.
Full Market Size
The ROI report has predicted that the market size for the year 2022 will be $197 million. Unlike the previous report, this prediction uses a new methodology. According to the new methodology, the market size in 2021 would be around $265 million, whereas the previous methodology had predicted it to be $166 million.
Therefore, going by the present method, the market has seen a decline this year, which can be attributed to the ongoing impact of COVID-19 and the downturn in the high-tech sector.
Opportunities, insights, and reflections:
Brokers fundamentally are the driving force of the patent market, with 90% of all the closed deals made by them. Despite the many deals closed, the overall closing rate is only about 30%.
Undoubtedly, large tech companies like Google, Apple, Samsung, and Microsoft are the favorite targets for patent sellers. They get accused of infringing on their assets, thereby subjecting them to litigation by the patent buyers.
It is interesting to note that while some technologies like augmented reality, virtual reality (AR/VR), and blockchain are attracting attention, they are not yet selling much. It is possible that they are still in their hype cycle and have not reached a high enough production volume.
Last year, we discussed how some patent sellers could not justify their high asking prices despite experienced players being aware of the fluctuations in the market. However, this year, the asking prices of sold packages are lower than those of unsold packages, indicating that the market is getting better at pricing.
One thing that remains constant amidst all these changes is the high litigation rate for NPEs (Non-Practicing Entities). It is important to note that regardless of the age of the patent, once it hits the market, it holds a litigation threat.
How can GreyB help?
On covering the nook and corner of Richardson Oliver Insights Brokered Patent Market Report 2022, one thing is for sure – It’s the best time to be a buyer, and NPEs are rightly using this opportunity.
Therefore, studying the Brokered Patent Market Report 2022 is a blueprint for essential decisions to enter the patent market. Eventually, the crux is to know the TRUE value of the patents you plan to buy or sell, and that is where GreyB comes into the picture.
With over a decade of acquired technical and manual skills, we deliver the best service to our clients. These include
- Patent portfolio analysis and smart planning in case of a licensing demand or lawsuit from an NPE;
- Deeper analysis of competitors’ and the general ecosystem’s licensing and sales activities;
- Bifurcating patent assets and identifying gold ones to sell (Sometimes identifying good patents and keeping those rather than abandoning them is the key task; read more);
- Curating a list of viable sellers and buyers (Check out our list of patent brokers and marketplaces to buy and sell patents)
- Filtering through patents and identifying important ones, focusing on their claims. This is vital as it lets buyers focus on the most critical parts of a package first and
- Developing evidence of use (EOU) materials. (Read our documented thoughts on what makes good EOUs here and here)
Get in touch to ensure you know the value of the patents you hold or plan to acquire.
Authored By: Annie Sharma, Marketing Team
