Case Study: How we mined through 1600 patents to find valuable assets
Patents aim to add value to a company through different forms of monetization, and when the size of the patent portfolio increases, it becomes all the more important to identify the top-line assets. Considering the difference patent mining can make to a client, it can be time-consuming when you have to find a dozen good patents that are infringed.
My team recently worked on a project where Solutions Co.’s patent portfolio consisted of a huge patent set. Here is how I implemented various strategies to handpick high-quality patents from the stack.
Background about the case
Jack, a patent portfolio manager of Solutions Co., came to us with a patent portfolio of 1600 patents. Huge patent set for sure! So, his main objective was to monetize the portfolio by finding a couple of patents that some big giants were infringing on.
If our team had proceeded without any plan, in the worst-case scenario, we would have analyzed all the patents. And that would have easily taken a huge chunk of our time, considering one patent needs 30-40 hrs of a thorough evaluation. So I folded my sleeves and started preparing the plan.
The first thing I did was, get an overview of the patent portfolio to know in which category these patents fall so that I could plan my strategies accordingly. On analyzing Solutions Co.’s patent portfolio, I saw that most patents were related to software technology. Since they were not diversified, I could work on them with almost the same blueprint. From here, with the help of my mentor, I had to devise a plan that would lead us to good patents in a shorter span of time.
Our plan
Usually, when a client approaches us with a huge patent portfolio, our biggest challenge is to race with time. Jack wanted us to find good patents at the earliest.
Manually analyzing the entire patent portfolio could take months. So a wiser strategy was to objectively evaluate the patent set based on certain parameters (e.g., claim length, priority date, citation data, etc.). That could provide initial level leads about the patent’s value.
To make the process even quicker, I utilized our in-house tools to evaluate and rank the patents for this case.
Our in-house tool, BOS, helped me identify a batch of patents that provided 102/103 rejections to patent applications of big corporations.
I ranked such patents higher since there was a higher chance that these corporates may be potential targets whose products could fall into the infringement category.
In addition to the BOS tool, I used some other tools for the patent ranking process, such as PVT and Slate.
After the automated evaluation, I prioritized the top 100 ranked patents from the list of 1600. These had good infringement potential. Also, these 100 patents make relatively smaller data, so I manually analyzed them.
To further narrow down the patent set, I evaluated each patent based on the following parameters-
- Claim density (i.e., length of claims, broadness of claims)
- Infringement discoverability (identifying the amount of product literature available for finding infringement evidence).
Generally, the less dense the claim, the easier it is to identify the infringement. Also, a quick product search for the patent’s claimed technology gives an idea of the literature available for identifying the infringement. Hence, the more the literature, the easier it was to show infringement. With this thought process, I went ahead.
I worked at a stretch, scored 40 valuable patents from the list of 100, and shared the update with Jack. He seemed impressed by how I cut down to these handfuls of patents.
These shortlisted patents were thoroughly checked for infringement in the next step, the detailed analysis phase. After a thorough investigation, we found a patent that stood out. We knew it was a bull’s eye for us. Let’s see why.
Detailed analysis
The detailed analysis involved understanding the patents individually, finding the potential overlapping products, and eventually gathering evidence to show the overlap for high revenue-generating products.
As I started diving deep into finding the evidence of infringement, I realized that showing a complete overlap from available product literature would be tricky. This was because the patents were too detailed and technical, while the product literature was elementary.
One of Solutions Co.’s patents – the one I will discuss in detail, had broad claims. By getting an overview of the patent, I noticed that the invention mentioned was used in most mobile phones with an internet connection.
Our first thought was that since billions of mobile phones are capable of using the internet, if I can show the overlap for these many mobile phones, our client will earn a SERIOUS amount of money. Having deduced this, I was a lot more enthusiastic about giving the best result to Jack.
Diving into the technology of the patent.
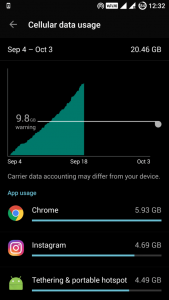
This patent essentially listed a method to measure and record mobile phone users’ internet data consumption. Most mobile phones nowadays, both android and iOS, have this feature that helps users to see how much internet data he/she has consumed. While going through the claims, I realized that the claims were simple and broad in the first place. I found 60% of overlapping information in the first 20 minutes of the analysis. An obvious thought came to mind, ‘will this be as easy as it appears?’
Shrugging the doubts aside, I immediately started to analyze the patent in detail. I thoroughly checked the patent and understood each embodiment.
After highlighting the required details in the patents, it was time to review whether these mobile phones actually followed the procedure claimed by the patent. But, there was this clause that says that the measurement of internet data consumption is entirely done by mobile phone without any outside entity’s help.
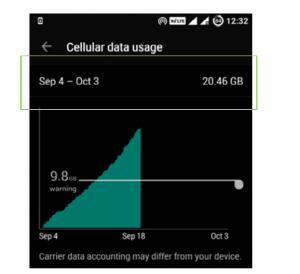
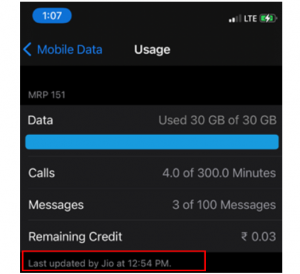
However, if you carefully see the second screenshot, you will see the “Last updated by Jio at 12:54 PM” text at the bottom. This screenshot belongs to an iPhone – the detail may seem minor, but this made a lot of difference to my search.
The highlighted statement denotes that the internet data consumption is measured by Jio [a cellular network in India], and this measured information is fed back to iPhone. This showed that the cellular network servers are measuring internet data consumption for iPhones. But according to the claim, mobile phones perform the entire measurement without interference from a third party. As a result, I had to discard iPhones.
Now, all I was left with were android mobile phones. My immediate concern was to see if the same case applies to android mobile phones or not. Apart from looking at the settings in an android phone, I checked android’s website and came across something groundbreaking – It was explained that the internet data consumption measurements are done in android phones, not in carrier network servers [see the below screenshot from Google’s website].

The above information was sufficient to show the complete overlap. I could have shared this with Jack, and that could have been it. But giving information is not GreyB’s style. We go to lengths to gather insights.
It wasn’t the end!
As I shared our results with Jack, I informed him that I would provide a much stronger overlap.
I immediately brainstormed with my mentor to learn other ways to strengthen the mapping. We came up with the next strategy: to perform product testing for android phones to ensure that the cellular networks do not actually interfere in measuring users’ internet data consumption.
I prepared a plan for conducting the testing to minimize the time and provide conclusive evidence. As soon as the plan was ready, I began conducting the testing. For this, I picked up the Redmi phone (the first mobile phone) and the Xiaomi phone (the second mobile phone).
A step-by-step explanation of the testing phase to confirm overlapping
Step 1: In the first mobile phone, I enabled airplane mode to ensure that it did not communicate with some exterior entity (such as cellular network servers) and noted down the internet data usage till that date. It displayed the internet data usage as 14.92 MB. I removed the SIM card from the first mobile phone while it was still in airplane mode.
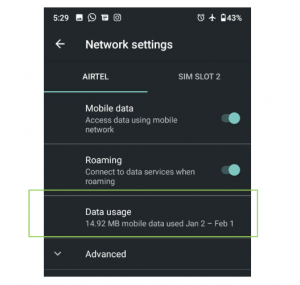
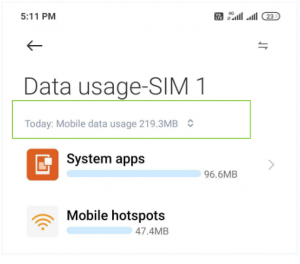
Step 2: The SIM card from the first phone was then inserted into the second mobile phone, and the internet data usage value was noted. It was observed that the internet data usage denoted the internet consumption when the internet was last used on this phone. The value came out to be 219.3 MB. The numbers differed on the two phones greatly.
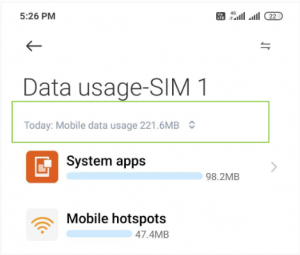
Then I started using the internet on the second phone with the help of the SIM card to change the value. An updated usage was noted that came out to be 221.6 MB. Next, the SIM was removed.
Step 3: The SIM card was re-inserted into the first phone while the phone was in airplane mode. Keeping the phone in airplane mode ensured that the internet data usage measurements made on the second phone were not added to the first phone through the cellular network. The internet data usage was found that the internet data usage value was still the same as the last time measured in this device in step 1 (i.e., 14.92 MB).
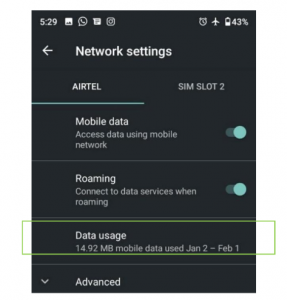
Additionally, this time I disabled the airplane mode to consume some internet data. The internet data usage got updated from 14.92 to 52.49 MB.
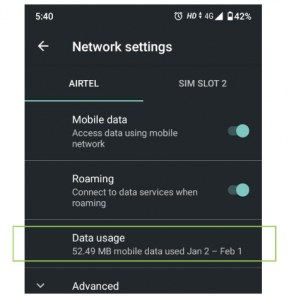
It was observed that this latest consumption value was added to the previous consumption reading on the first phone (i.e., 14 MB) instead of the consumption reading on the second phone.
With this, the testing came to an end.
The results of the product testing.
Having noted every detail derived from the above steps, it was time to lay them out to make sense of them. The testing was implemented using a single SIM card which helped me prove that both mobile phones displayed internet data consumption readings that were not measured by the cellular network.
To follow through with the claim, I was able to conclude that since both phones used a single SIM card, the internet data usage readings on both phones were different.
Now, I was left with the last clause of the claim about displaying the measured internet data consumption reading on the phone’s display. A screenshot of the phone’s settings showed that it displays the internet consumption readings on the screen.
And that’s how we wrap
Combining the product testing and the above snapshot, I ended with a 100% overlap. But we don’t leave any stone unturned. There isn’t any harm in concluding the case over here but bear with me for a little longer as I take one more step to make an even stronger mapping.
I Investigated Android’s source code to find the code that displays internet data consumption on the phone’s screen. Here my knowledge of codes came in handy.
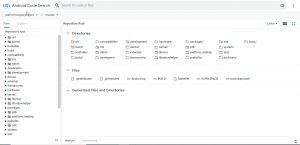
I opened up android’s source code website, and there were so many directories [see the below snapshot].
Though I had knowledge of codes and their usage, given the extensive data I was dealing with, this situation was the same as finding a needle out of a haystack. I scrolled through some StackOverflow and medium articles and learned how android measures users’ internet data consumption. As a result, I knew where to start the search.
I searched for a particular class that is responsible for internet measurement and displaying and landed on a page like this-
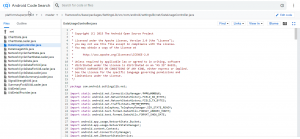
On foraging every line of the code very carefully, I came to know about “getUsageLevel,” which measures the internet data consumption with the help of the “getRxBytes” and “getTXBytes” methods. A combination of these methods helps Android display the user’s internet data consumption on the phone’s screen.

Now that’s how we roll wrap!
I found out exactly how android phones measure internet data consumption and display it over the phone’s screen. But before handing this information to Jack, I cross-verified it with the software developers on our team. On discussing my findings, they agreed to whatever I had deduced. And it was time for my favorite part of the job- providing good news to the client.
I shared it with Jack; he was happy to know the news and appreciated the efforts. This was a gem patent in his portfolio and served the purpose as big companies were infringing it.
Conclusion
While automated tools can greatly expedite the search process, manually mining these patents was the key to winning. As a result, it is important to devise a smart strategy to ensure that essential patents are not missed due to time constraints.
If your patent portfolio consists of many patents, and you wonder how to extract high-value ones. Well, you do not have to keep wondering. Reach out to GreyB experts and let them handle it from there.
Get in Touch
Authored By: Hritik Negi, Infringement Team
Edited By: Annie Sharma, Marketing Team


