Last time we shared how Monika helped everyone learn a trick on Excel, this time Mahesh from the Search Team who prepares a lot of deliverables conducted the next activity. His objective was to convert the boring report sent by him into a designing masterpiece that could make a client fall in love with your report!
Deliverables in our industry are a result of an extensive research. Sometimes there a plethora of information that needs to be studied and analyzed in a short interval of time. Therefore, most of the time the report looks like the table below.
So here is what hit everyone’s mailbox that day as a 10 minute activity:
Today’s activity is focused on to learn something that could make clients fall in love with your reports and presentations!
Take a good look at this table. See something wrong?
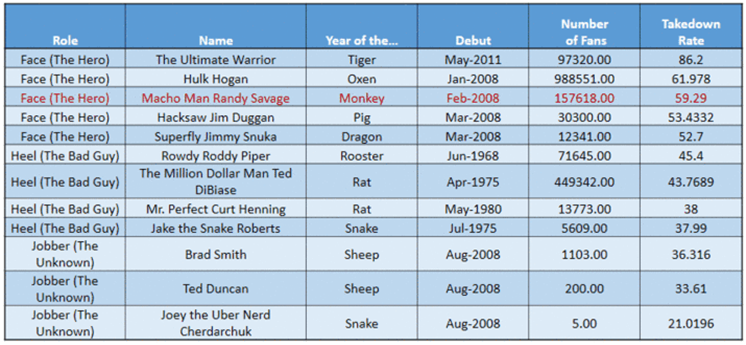
No, not the data, the data is correct. Someone has done a good amount of time to do the research and get these figures.
It’s the appearance that is ruining everything. It is as if the table itself is saying, “No, please, don’t read me! I am boring! Go, do something else. I will only frustrate you.”
So, your task today, is to do some make-up on this table and make it look presentable. Notice the third row, you need to grab the user’s attention to it, it is something important.
Use the attached file for doing your experimenting. 10 minutes.
Regards,
Mahesh
Do you want to know who the winner was of this activity? Consider reading the email sent to announce winner yourself:
Hi
I would not name any winners because beauty is not quantifiable.
Leaving the scoring to you, I would like to share with you a design theme, called Minimalist Design, which rests on the philosophy less is more.
See the Presentation below in full-screen, spend 3-4 seconds per slide, and you would understand what this design philosophy means.
Next time you would be making a table, you would feel the difference!
Here is the slide deck finally shared providing an idea of different steps that could be taken to improve the appearance of the table:
Authored by: Deepak Kumar, Research Analyst, Marketing Team