As per the World Economic Forum’s Global Competitiveness Report 2019, Singapore is ranked second in the world and top in Asia for having the best IP protection. This is pretty impressive as the World Economic Forum considers various factors for this evaluation, like ICT adoption, infrastructure, health, labor market, etc. (Source).
One of these factors is the innovation capability, which made us wonder how Singapore is actually trying to establish itself as the next IP hub of Asia and who (local and foreign companies, universities, etc.) all are contributing to its growth.
To that end, we dug up all the patents that got published in Singapore jurisdiction in the last 6 years and dissected them to see what is happening.
Exploring all the patents filed in Singapore in the last 6 years
Where did the majority of Singapore’s innovations come from?
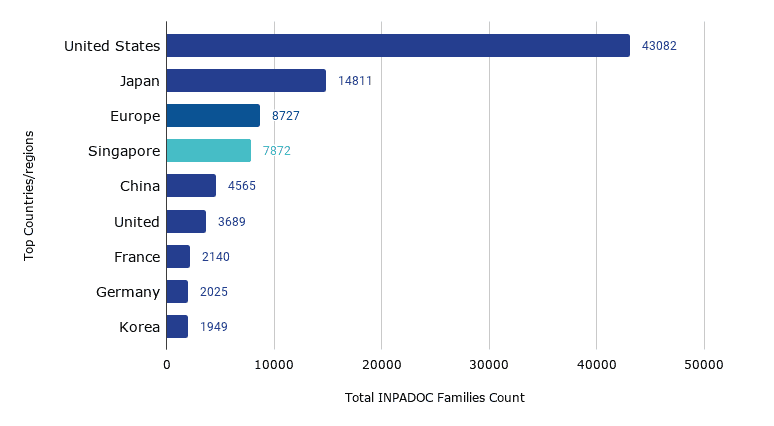
- Patents published by residents of Singapore have increased by ~30% in the period 2015-2020 compared to the period 2009-14. In the period 2009 to 2014, 6022 patents were published whereas, between 2015 and 2020, a total of 7872 patents have been published.
- The major contribution however came from the USA and Japan. Out of all the patents we considered, ~44% originated from the US and ~15% from Japanese entities.
- Europe, China, and the UK are a few other top countries from which entities have contributed significantly to the Singapore patents published in the period 2015-20. The following statistics detail the number of patents (i.e. equivalent to the amount of research) that originated from other countries and got published in Singapore.
Note: We have used the Derwent database to retrieve total patent records (collapsed on the basis of application numbers) that are published in the years 2015-2020 and have claimed priority of different countries. To fetch these numbers, we ran the string – CC= (SG) AND (DP>= (20150101)) AND (DP>= (20201231))
How, each year, research originating from Singapore, the USA, and Japan contributed to innovation?
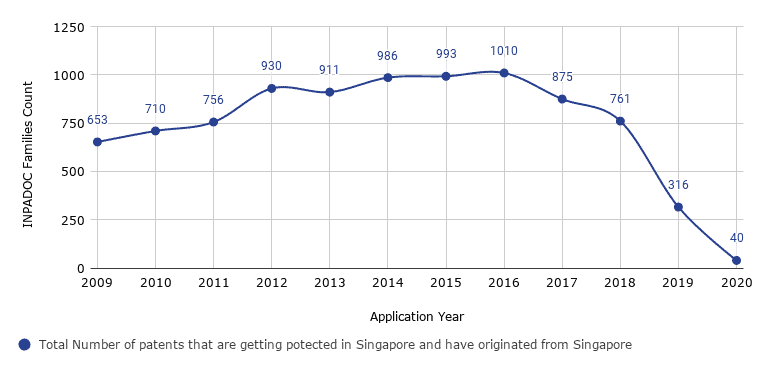
Note: We have used the Derwent database to retrieve total patent records (collapsed on the basis of application numbers) that are filed between the years 2009-2020 and have claimed priority from different countries. To fetch these numbers, we ran – CC= (SG) AND (AD>= (20090101)). Also, the decline in the number of patents from 2018 to 2020 could be because of the fact that not all the filed patent applications would have been published.
Clearly, Singapore-originated innovations increased in number consistently over the years. Between 2009 to 2016, the number of such patents increased a whopping 54%, thereby indicating increased R&D activities in Singapore.
This increase could probably be because of the various measures taken by the Singapore government. For instance:
- On numerous occasions, the Singapore government provides funding for R&D and patent filing.
- Not only this, in every five-year science and technology plan, the Singapore government increased the budget. (Source, Source)
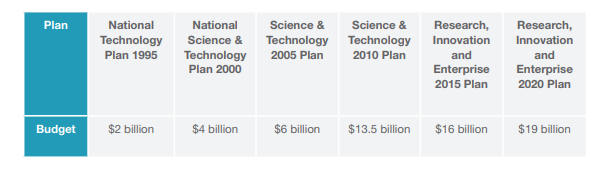
*Source: RIE 2020
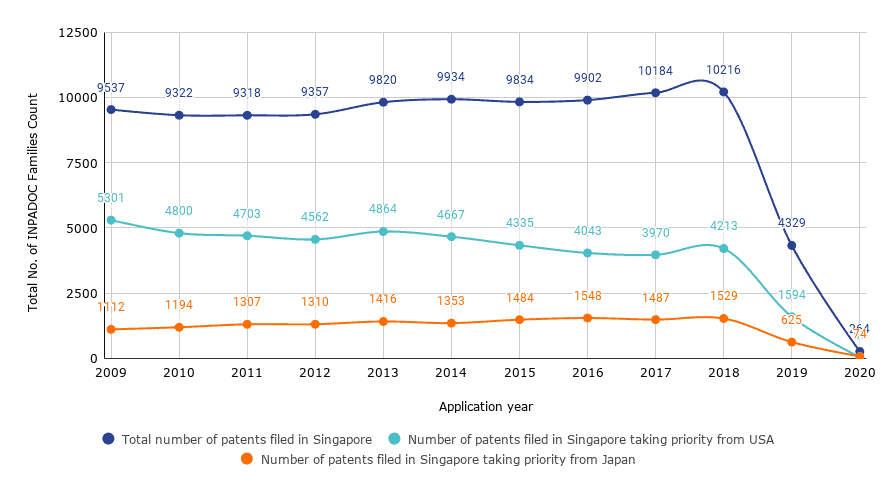
- The number of patents filed in Singapore from Japan has increased over the years. When compared to 2009, this number has increased about 37.5% in the year 2018.
- The number of patents filed in Singapore from the USA, on the other hand, has slightly decreased over the years. Compared to 2009, it has gone down by 20% in 2018. In spite of this decline, USA-originated inventions still hold a lion’s share of Singapore patents (46% of patents filed from 2009-20). Whereas the next largest contributor Japan is much below in the scale with a mere 14%.
Our next step was to see which Japanese and American companies are contributing to this patent filing in Singapore.
When we saw this stat, this question popped up in our minds –
Which Top companies filing patents in Singapore are taking priority of US and Japan?
Here’s what we found.
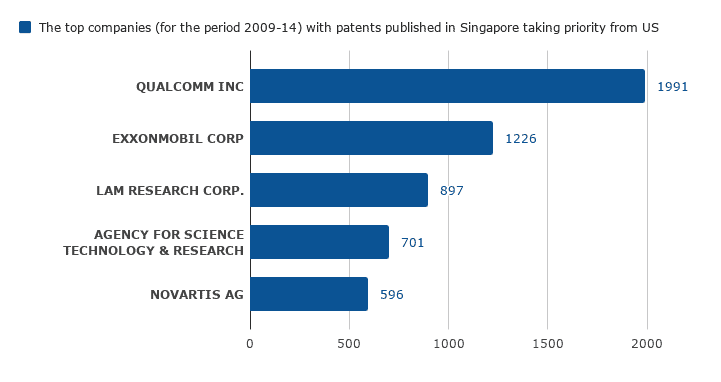
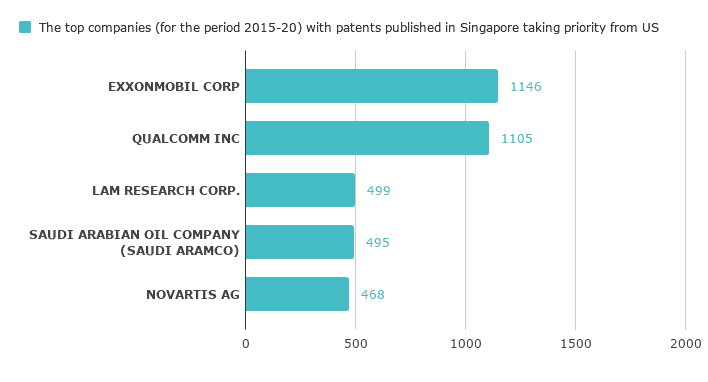
Applicants taking priority from the US
 Applicants taking priority from Japan
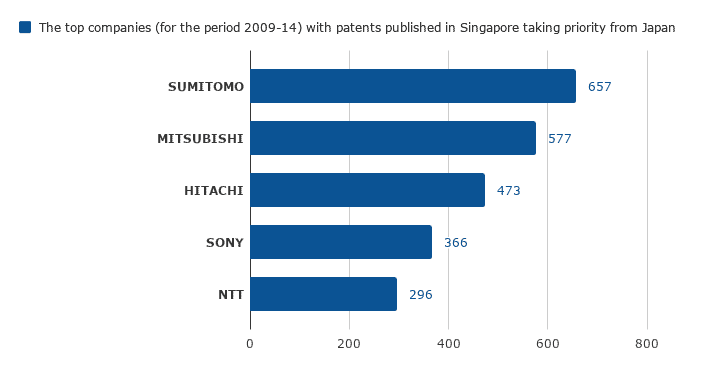
Note: We have used the Derwent database to retrieve total patent records (collapsed on the basis of application numbers) that are published in the period 2009-2020 and have claimed priority of the USA and Japan respectively.
- ExxonMobil seems to lead the research in the US for the period (2015-2020) with around 1146 patents in Singapore. However, compared to the 2009-14 period, ExxonMobil’s total number of published patents in Singapore seems to have decreased (by 6.5%).
- Qualcomm, in the period 2009-2014, was leading the research in the US with 1900+ patents published in Singapore. However, this number went down by 44% in the period 2015-20, thereby bringing Qualcomm to the second position.
- One interesting trend that we found is a strategy shift from Agency for Science, Technology, and Research (i.e. A*STAR – Singapore’s government agency).
For the period 2009-14, A*STAR seemed to be among the top filing entities with 707 patents published in Singapore taking priority from the USA. However, in 2015-20 this changed. On taking a closer look, we found that the overall number of A*STAR’s published patents has not changed much. But they have started filing their patents first in Singapore, then in other countries.
This strategic shift seems to be aligned with the various initiatives taken by IPOS to expedite the application-to-grant process of patents in all technology fields to six months, compared to the typical duration of two years. For instance – in 2018, FinTech fast track initiative was taken to advance the file-to-grant process for FinTech patents. Then in 2019, a similar initiative was undertaken for AI patents. Later, in 2020, IPOS launched the SG Patent Fast track Program which aims to expedite the application-to-grant process of patents in all technology fields. Source, Source, Source
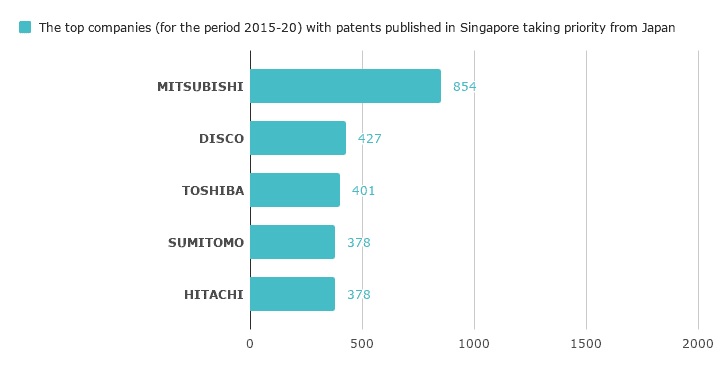
- Further, on checking the trend for Japan, we found that Mitsubishi (a Japanese multinational automotive manufacturer) has clinched the top position with 854 patents published in the period 2015-2020. Noticeably, this number has increased by 48% when compared to the number of patents published in the period 2009-14, which clearly demonstrates Mitsubishi’s increasing interest in Singapore. This trend is also supported by Mitsubishi launching M’s BRIDGETM (in 2019), a global remote-maintenance service for the continuous monitoring, inspection, and data analysis of elevators via an IoT platform in Singapore( Source).
- Disco Corp, a Japanese precision tools maker (especially for the semiconductor production industry), has secured the second position in terms of the highest number of patents published in Singapore (427 patents) taking priority from Japan, for the period 2015-20. Whereas, for the period 2009-14, the company had only 27 patents published in Singapore.
We tried to check the market data in order to figure out the reason behind this trend and found that there has been strong growth in the semiconductor production area in Singapore (since 2017). As per Singapore’s Minister of Trade and Industry – the “semiconductor industry has continued to grow steadily and the sector has very bright prospects in the coming years”. So, it is very likely that this huge market potential of semiconductors would have triggered Disco Corp to protect its invention in Singapore as well( Source, Source, Source).
Next, we explored the entities doing R&D in Singapore (i.e. filing the first patent family member in Singapore, then in other countries).
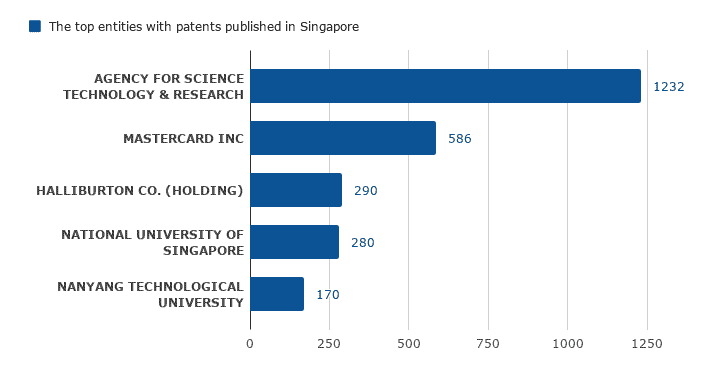
In the case of innovations originating from the USA and Japan, we noticed that the top patent filers are companies only, not academia. We wanted to see if the same trend holds true when it comes to Singapore-originated innovations. However, the data showed a different picture. Here are the top research entities of Singapore –
Note: We have used the Derwent database to retrieve total patent records (collapsed on the basis of application numbers) that are published in the period 2015-2020 and have claimed priority of Singapore itself.
As you can see, unlike the patents from the USA and Japan, when it comes to Singapore R&D, only two out of the top 5 entities are companies – Mastercard and Halliburton – and interestingly, both are foreign companies. The other 3 contributors are the government-backed research institutions – the Agency for Science, Technology & Research (A*STAR), National University of Singapore (NUS), and Nanyang Technological University (NTU).
Noticeably, A*STAR is the top-ranked Government and Research Institute of Singapore based on publications during the period of 2015-20. It has formed major partnerships with Fujitsu, P&G, ARTC, GE Healthcare, L’Oréal, and Lloyd’s. Recently, STMicroelectronics also collaborated with A*STAR to advance the adoption of piezoelectric MEMS in Singapore. (Source, Source)
While going through these numbers, another question we decided to answer was–
What does the patent filing trend of these Singaporean universities look like?
We crunched the numbers and the below image portrays the patent filing of A*STAR, NUS, and NTU in Singapore.
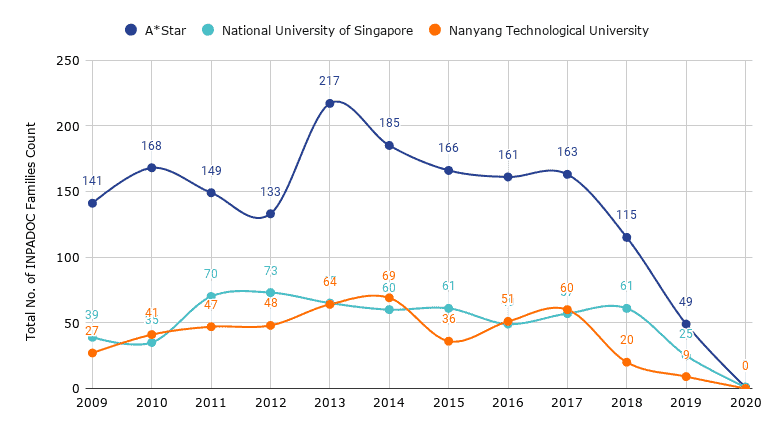
Note: We have used the Derwent database to retrieve total patent records (collapsed on the basis of application numbers) that are filed in the years 2009-2020. To fetch these numbers, we ran – CC= (SG) AND (AD>= (20090101)). The dip after 2018 might be because of the fact that all the patent applications would not be published yet.
From the year 2009 to 2017, the number of A*STAR patents seems to have increased by around 14%.
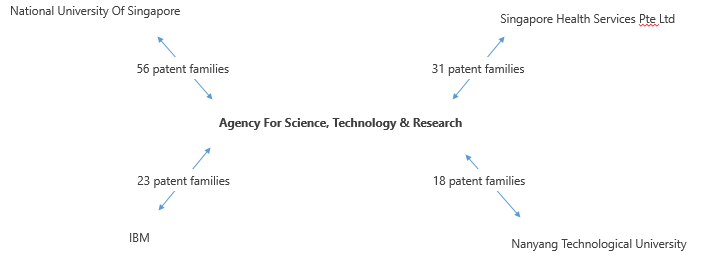
It is a well-known fact that a lot of companies collaborate with universities to benefit from their rich R&D resources and scholars. We wanted to figure out which companies were collaborating with the above-mentioned universities and were responsible for some of these filings. Here’s what we found.
Who are Singapore universities collaborating with?
This list includes a lot of prominent names from around the world – International Business Machines (IBM), Massachusetts Institute of Technology (MIT), Huawei, it goes on. The images below contain more details on the patent association formed as a result of a few of these collaborations.
![]()
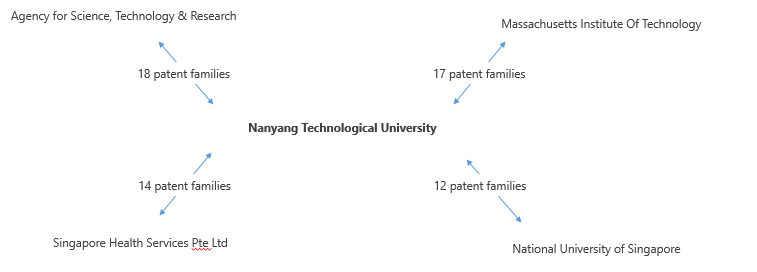 Note: The data in the above charts covers major collaborations only and we have used total patent records (collapsed on the basis of application numbers) to plot these collaborations.
Looking at these charts, it seems research collaboration is common among these universities. Further, for the period 2009-14, A*Star filed 72 patents in collaboration. And, from 2015-20, it filed 188 patents in collaboration, a significant increase in collaboration activity.
Concluding Notes
This gets us to the end of the article. However, this is rather the start. This article is the first in our series of articles covering our analysis of Singapore’s IP statistics. Subscribe to us to get notified when the next part of the analysis – IPOS Performance over the years – goes live. And if you’d like more information, feel free to reach out to us here.
Note: The published and filed patent set for 2009-2020 has been extracted from Derwent Innovation. For plotting all the charts, we have considered the patent records and collapsed them on the basis of application numbers. Moreover, the dip in the filing trends (after 2018) is because all the patent applications might not be published yet.
Authored by: Ambuj, Sarvagya, Komal, Sushant Kumar, and Shikhar Sahni.