Do you use Salesforce in your organization?
If yes, this write-up is for you.
Excuse me for starting the article abruptly, but I don’t want to waste a second and directly jump on to help you with saving time (see what I did there?).
Recently, we were in talks with the IP counsel of an American multinational company based out of Dallas, Texas.
During our conversation, we came across their struggle with patent portfolio management. Since we were aware of the functionalities of Salesforce, we started brainstorming on this question – How can Salesforce help with the management of a patent portfolio?
At a quick glance, Salesforce looks like any other GUI based CRM. But, over the years, it has turned out to be much more than just a CRM.
This is because of two features that all your SaaS vendors have been boasting about all these years — High level of customizability and usability.
Salesforce is more or less like a swiss army knife as it comes pre-loaded with a multitude of tools to enhance user experience. If you need to integrate some business logic into it, more often than not it can be done using the in-built tools and libraries available within the Salesforce ecosystem.
Now, here’s the interesting part.
Salesforce also provides the ability to extend or override the existing functionality up to a certain extent to make the flow of the interface users friendly. These features can also be used to convert the Salesforce CRM to a full-fledged patent portfolio management system.
Some of the functionalities that can be customized based on user requirements include:
- Branding
- User interfaces
- Data workflow
- Triggers to automatically update data based on predefined rules
- Approval processes
- Data representations
- Reports and Dashboards
- Custom functionalities
As someone who manages the patent portfolio of the organization, decisions based on data signals in the portfolio play a major role in deciding the strategy, and the next course of action for you.
These actions range from and/or include:
- Building a portfolio
- Selling patents
- Licencing
- Tracking office actions and so on…
These signals are crucial in building and monetizing a patent portfolio.
Now, the problem isn’t in managing all this. But, when you handle a patent portfolio of an organization that is growing and increasing its IP reach rigorously, this might consume a lot of your time.
All this data becomes noise for you. And, this is exactly where we enter the picture.
 How can this noise create major leakages in your system?
It is similar to missing maintenance fee payment for your granted application and then paying an additional charge. We all know that maintenance fee cycles are fixed and can be easily tracked.
The signal here is the grant date of the patent application that became noise when it was not handled properly by the system.
While talking to counsels of Fortune 500 organizations, we have realized that this noise is usually caused by factors like,
- Integration problems in different tools.
- Error from one system propagating to others creating a chain reaction.
- Overwhelming the users with unnecessary information such as
- Promotional emails.
- Reminders that cannot be turned off.
- Recurring unwanted reports.
Some organizations work with a multi-tool infrastructure, where several general-purpose tools are used to solve individual requirements.
This could be a docketing software, a tool for managing portfolios or to track case communications, and so on.
What’s the challenge then?
These tools are not built to interact with each other. No communication? No gains.
Information sharing and collation is a difficult task in itself.
Another common issue that can happen in such systems is Error propagation. Errors generated in one system can make the entire setup unstable and the error could as well propagate to other systems during data syncing.
Salesforce: a one-stop solution for all your patent portfolio problems
All these errors can be easily corrected in a centralized system like Salesforce.
You see, most of the generalized solutions/tools available in the market come pre-loaded with email nurturing utilities that broadcast generic information over time with little to no control over personalization.
Their nurturing emails, which are meant to be helpful, ultimately get converted into noise.
Remember when you last received that weekly summary of your portfolio, but hardly anything changed. Yes! That is the noise we are talking about here.
These problems diminish the key advantages of a generalized solution. As more users understand these shortcomings, we have seen a rise in the number of clients requesting tailor-made solutions rather than the one-size-fits-all approach.
Here comes Salesforce into the picture with its high customizability and multitude of tools. With Salesforce, users can manage everything in a centralized interface and even build workflow, reports, and triggers around their data.
Wait, the data. I know that you have a tough time dealing with patent data. So, let’s talk about it now. It’s the time for some patent data rants now.
What’s all this fuss surrounding the patent data?
Working with patent data can be tricky at times as it contains multiple layers of information on a single level. These information layers can be categorized into two main categories — direct layer and derived layer. Direct information layers, as the name suggests, is the information available within the patent data such as
- Patent Term Adjustment
- Citation Data
- Terminal Disclaimer Data
- Parent-Child Continuity Data
- IPC and CPC classes
Whereas the derived data layer is more of a smart layer created on the direct layer. It can be created by a combination of multiple layers and is meant to derive insights like:
- Maintenance fees – which can be derived from the grant date.
- Expiry Date – derived from the grant date and patent term adjustment.
- Business Opportunity – please head to this section for a more elaborate explanation.
- Filing Impedance
How can Salesforce save me from the wrath of infinite patent data?
Salesforce provides a wide range of tools to integrate these smart layers into the interface without much effort. Some of the tools available for such customization are:
- Visualforce Pages – Web pages embedded within Salesforce.
- Lightning Web Component – Modern web applications based components that can be easily integrated with the existing interface.
- Workflows – Predefined set of rules that defined the flow of data.
- Approval Flow – Approval process that can be set up to change the state of data based on approval from a superior authority.
- Triggers – Automated business logic that runs on data change.
For example, we integrated the Slate tool in Salesforce.
This recent article will tell you all about it – This tool can help monitor prosecution health and save you millions.
It looks something like this.
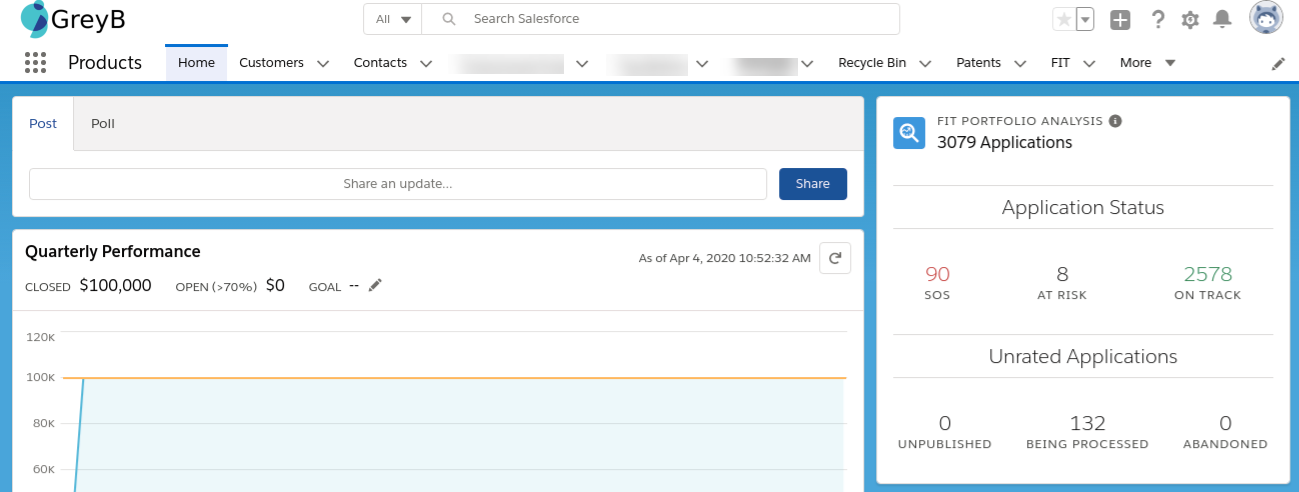
(An image-based evidence of two tools going hand-in-hand with each other and we are loving this amalgamation)
Data representation: an untold story struggle
Licensing and selling of patents revolve around grouping the patents in the same family together and bundling them to create a sales/licensing opportunity. This grouping of data can be done using multiple direct layers but for simplicity let’s take 3 of them.
- Terminal Disclaimer Data
- Continuity Data
- INPADOC Family Data
Grouping the data using these parameters is only half the battle.
A major challenge is to represent the grouped data in a way that all linkages are visible and users can look up two data points that can be connected by any linkage.
Now, we tried the tabular approach but the problem is that it just gets too complex.
| Patent Number | Group | Terminal Disclaimer | Continuity Data | INPADOC Family ID |
| Patent 1 | Group 1 | TD1 | ||
| Patent 2 | Group 1 | TD2 | Patent 3 | 20200425USPAT |
| Patent 3 | Group 1 | TD2 | Patent 1 | 20200425USPAT |
| Patent 9 | Group 3 | TD3 | Patent 7 | |
| Patent 4 | Group 2 | TD4 | 20200425USPAT | |
| Patent 5 | Group 2 | TD4 | Patent 4 | 20200425USPAT |
This obviously calls for a graphical representation of data.
But, wait, we are dealing with 3 layers of information that should be clearly visible on this graph. Not that easy mate!
None of the existing solutions out there could easily accommodate this requirement.
On top of that, we also need to find and display the ways any two data points can be connected.
I hear you, and here’s an integrated system, sir/mam…
So, we built a system on our own freaking terms. We custom-coded a charting library inside Salesforce using visual force pages, and the result was something like this.
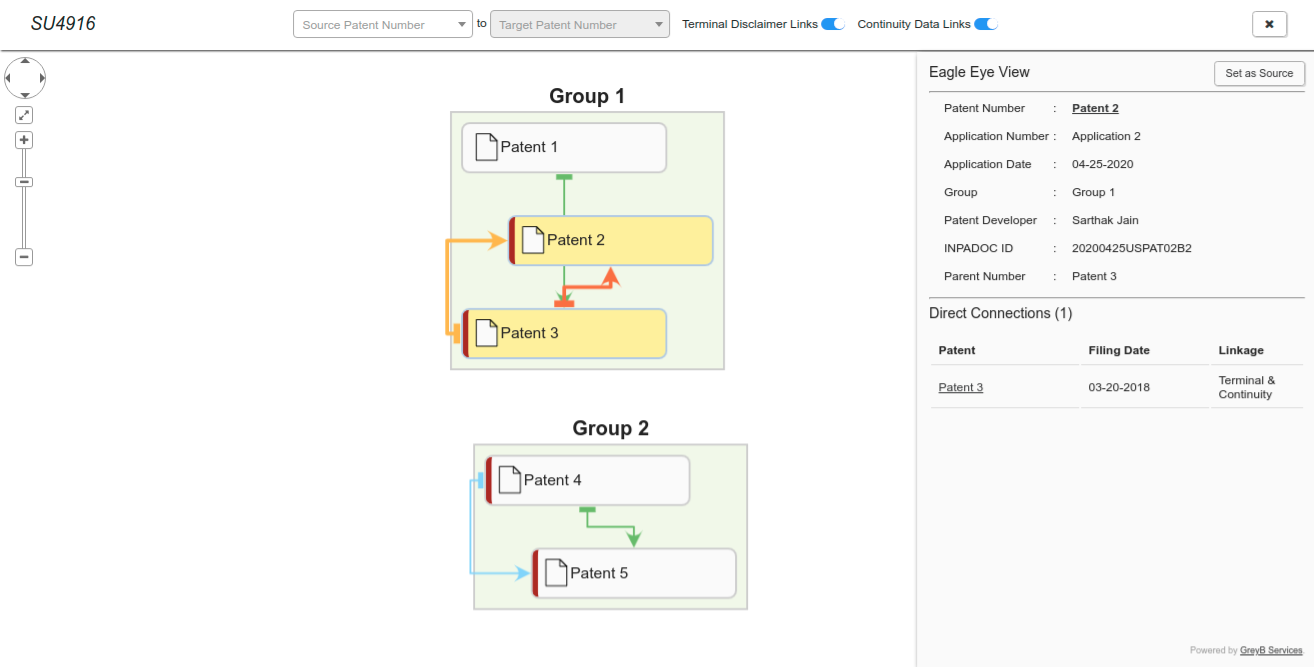
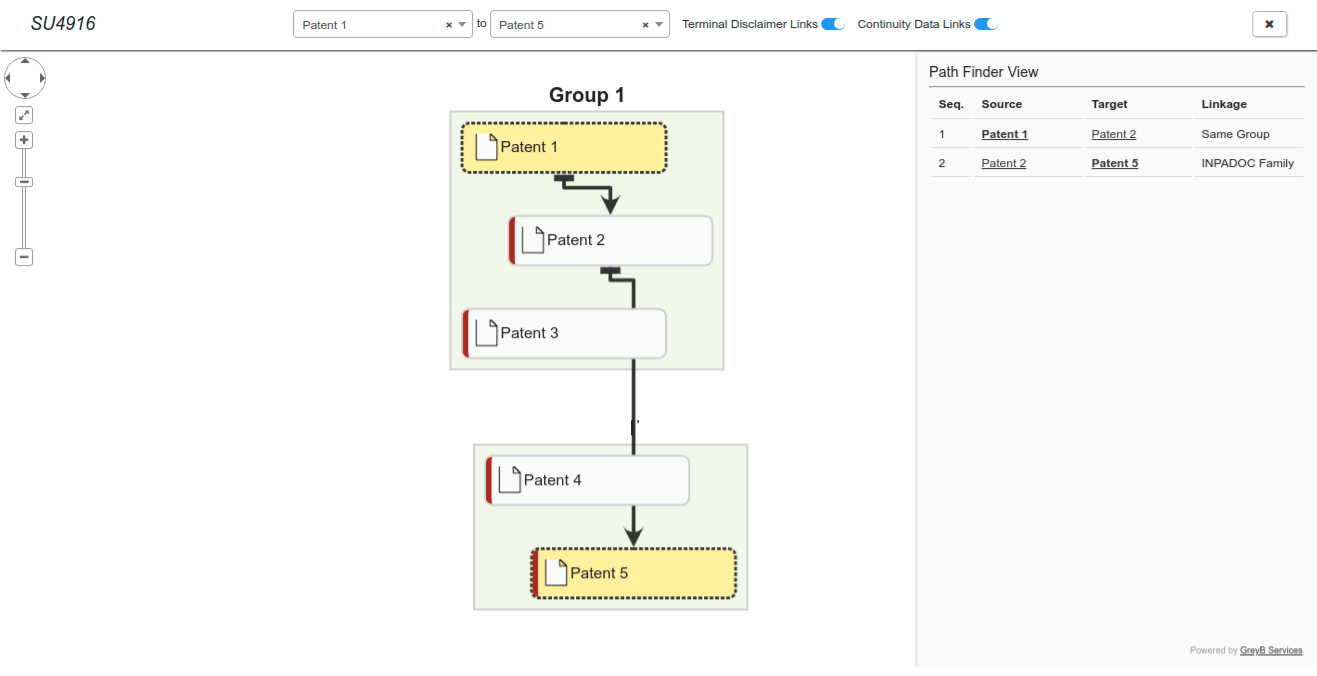
Impressed yet? No! Ok, then look at this one:
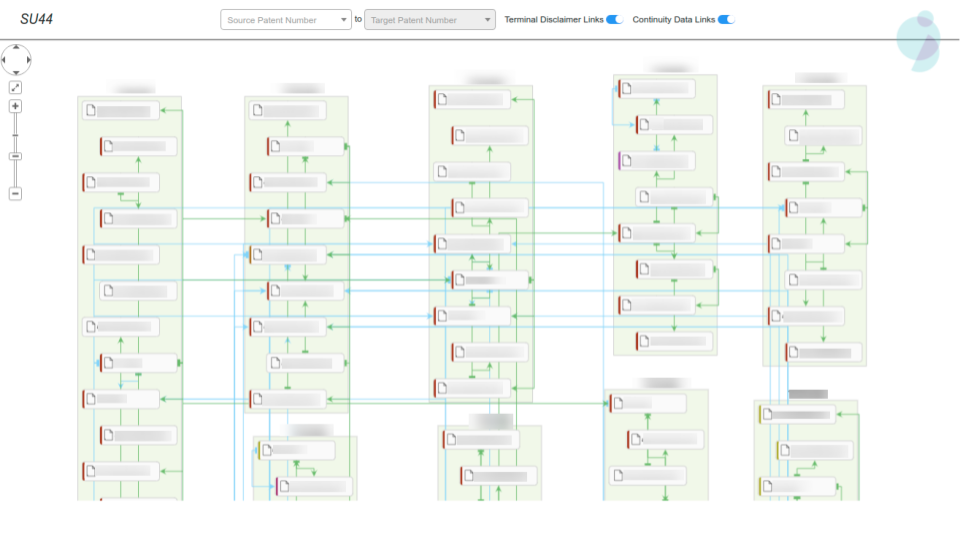
The benefits of these solutions are clearly visible with a large dataset. I mean, just imagine using an Excel sheet to track linkages in this data and jumping from row to row just to find that one link. With this simple yet elegant solution, we saved hours of our client’s precious time.
Talking about elegance, talk to us for your own share of exaggerated elegance in the data that you use every day. It works like magic.
My sales team just gets too excited whenever we get clients who love similar custom-based solutions.
You’ll only understand the level of passion that they have for tools when you send a hi to the above address. Trust me, these guys don’t disappoint anyone.
Authored by: Sarthak Jain, Product development.