If I tell you, you could customize your internal patent tools with additional information, do you know the kind of possibilities it can open up?
Depending on the tool and the customization, you can find patents and applications that are eating up resources without being of any value, taking exceedingly long to grant, and are costing you millions in appeals, amendments, and RCEs. You would want to know more about these applications and patents eating up your budgets and then design a strategy for cost-saving.
For context, Samsung alone could have saved millions of dollars on office actions in various technology areas.
To take an example, Samsung spent ~$37.3 million (based on probabilistic estimate) on a single technology area i.e., 2800,(“PHYSICS, OPTICS, SYSTEMS COMPONENTS & ELECTRICAL ENGINEERING”).
The story is not much different for other companies either. We recently analyzed a lot of top US companies w.r.t their US office action data and found that most of them are bleeding through their budgets.
We then put our heads together about IP Counsels and found most of them were interested in reducing their budgets but do not have sufficient time to work on it. We all know that getting one or two additional office actions may not seem significant and most likely not worth the attention/effort. Its not uncommon. We all have few things that if we do can give us huge return in our personal life as well but we delay it due to various factors. This situation is no different from that.
However, when you file patents in volume each year, and have to pay an additional ~$4000-5000 per patent in the coming year for each office action, i.e., Amendment, Appeal, or RCE, the entire narrative changes. Your huge problem will cost you millions or even billions based on the number of patent applications you file each year.
Your focus is to get your patent granted as efficiently as possible.
But how do we define efficiency? When can we say that a patent grant was efficient, how do we determine it – is it time to grant, is it less cost, is it quality of claims, is it the value of the patent based on its overlap to business, or how well it can protect competitors? It’s important to define it.
The answer is hidden in historic data if we study the successful portfolios. However, it’s not accessible in a human-friendly form, so we never get to know for sure if our patent portfolio is moving toward success or an average line.
Here we want to focus on the prosecution parameter. One of the objective parameters is the number of rejections received. Can we put a threshold on this number? How do we say that we are ‘bleeding’ unnecessarily? What should be labeled as a danger (SOS) zone?
These answers are also buried in past data because every application must be prosecuted in the patent offices. We have also noticed that these leaks usually happen in the blind spot and might be too small to be captured by the radar. When they compound over time, they become significant for sure.
How to make sense of historic data and make better decisions?
Let me share a custom product that we built to highlight this blind spot. The custom product provides visibility to the in-house counsels about the health of their patent prosecution process.
Let me try to showcase it with an example. We tried to showcase the actual position of an application based on the prosecution history at USPTO and segregated the portfolio in 3 buckets –
- SOS – Pending applications facing high difficulty/barrier at USPTO
- At-Risk – Pending applications which can face high difficulty/barrier at USPTO
- On-Track – Pending applications being prosecuted smoothly at USPTO
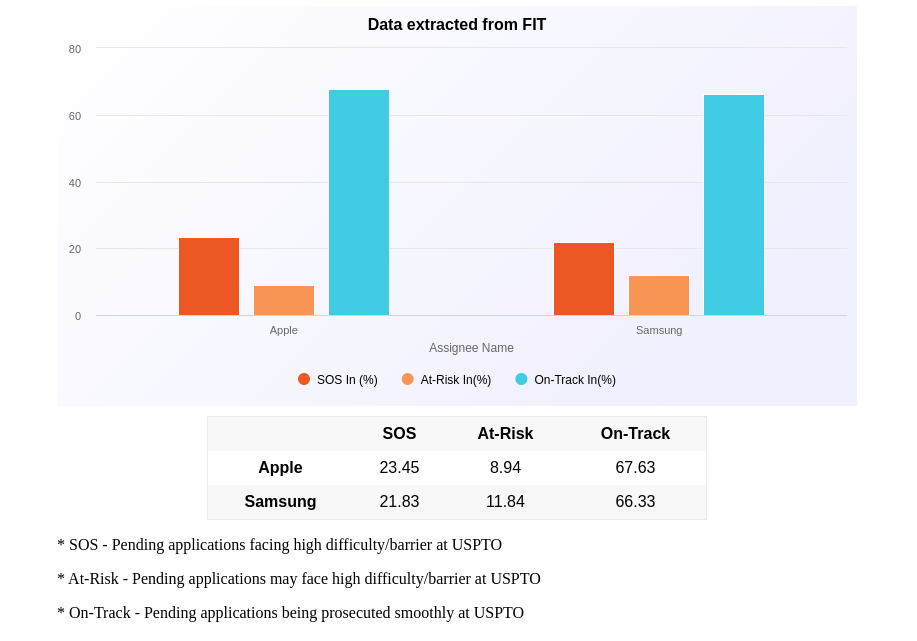
To put more context, we picked two big players (Apple and Samsung) active in patenting and compared their active US applications in the past 20 years. The numbers were surprising.
We are defining the SOS category as a danger zone. How do we calculate it?
Well, the tool uses various attributes of the application like:
- Office Actions (non-final rejection or final rejections)
- RCE (Request for continuous examination)
- Appeal and
- Interview
to decide the actual position of the applications. This is then compared to the threshold value for these parameters, set based on the historic data in that technology. If this threshold value is greater, equal, or smaller than our listed parameters, then they are bucketed accordingly i.e., SOS, At-Risk, or On-Track.
What’s the benefit of monitoring the portfolio in such a way?
One is to get to know the health status of a portfolio.
Another is we can also look at the assets that can be pruned or are eating up the budget.
On average, a response to office action costs ~$4000-$5000 in the US including attorney fee (according to AIPLA) and government fee (according to USPTO). Based on the cost of office actions we can calculate the overall cost incurred for a single technology.
For the sake of example, we picked “2800 (Optics)” technology for Samsung to get a clear picture of how much amount has already been spent in a single technology, and here is the amount we came through.
Samsung bled ~$37.3 million (broadly) in a single technology in the last 20 years according to their portfolio strength.
If we expand our analysis, Samsung’s portfolio is active in 10 technologies including technology centers 1600, 1700, 2100, 2400, 2600 along with five others.
If we average this estimate across these 10 technology centers alone, the amount would be in hundreds of millions.
This money could have easily been utilized in filing more applications and other things.
In fact, Samsung faced 831 extra office actions compared to the average number of office actions on their stuck applications in the technology area 2800 alone.
Disclaimer: The above numbers are calculated taking into account the SOS applications (pending applications facing high barrier) of Samsung’s portfolios over a span of 20 years in a technology. The ideal number of office actions or RCEs should have been ~6867 based on the average number of office actions in that specific art unit, but for Samsung, the number was around 21333.
Had companies like Samsung used products that could track their prosecution health, it would have saved them hundreds of thousands of dollars spent by figuring out and weeding out unnecessary Amendments, Appeals, and RCEs.
The ultimate solution to track prosecution health and enhance grant rate of applications
To make sure these kinds of problems don’t arise during prosecution, we developed a custom product solution so that the said visibility is easily achieved.
FIT (Filing Impediment Tracker), our in-house tool, is built to provide insights and suggest strategies to make application prosecution smoother and provide visibility of application prosecution.
Additionally, FIT also provides few suggestions to prevent At-Risk applications which may go into SOS and these suggestions act as a catalyst to boost up your SOS application prosecution to get patents granted ASAP.
These include:
Always being aware of the law firms that are doing tremendous work (in your art unit).
For instance, in the graph below, you can see that the highlighted law firm prosecuted a total of 37 applications and had an allowance rate of 100% in the art unit 2658 which is the best number.
Suppose, your application is being prosecuted in art unit 2658, and you want to make sure it gets granted, you might want to peruse the below list showcasing the top attorneys in the same art unit who might work better as the current attorney.
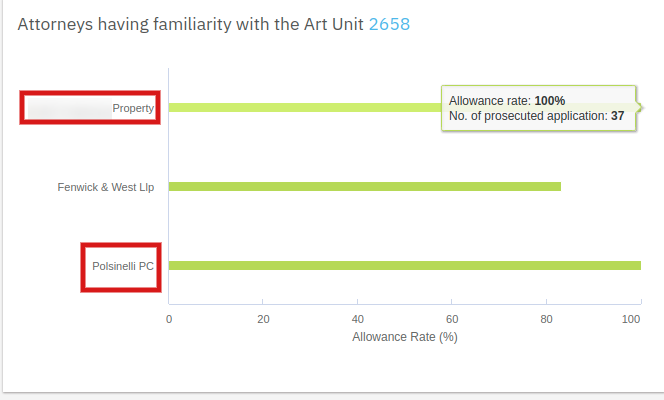
The tool provides insights into law firms listed that have better allowance rates than the current one. It can help you estimate whether or not the slow grant of an application is due to a particular law firm, and if yes, help choose a law firm that has a better allowance rate.
Strategies to get application granted on a fast track
Depending on the examiner’s history, the user receives strategies or ways to get the applications granted in a fast-track mode. It can help foresee which strategy works with an assigned Examiner.
In the below chart, we can see that for examiner “Adesanya, Olujimi A” there is a high chance of getting a patent granted if RCE is requested, because, for this particular examiner, there is a 42.02% chance to get a grant after RCE in same art unit(2658) as shown in Fig1.1.
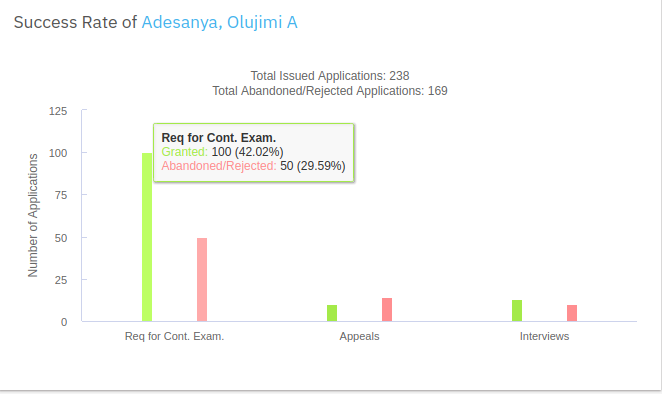
Fig 1.1
Suppose if the applicant requests for Appeal or Interview, there are high chances that the patent might get Abandoned/Rejected as shown in Fig 1.2
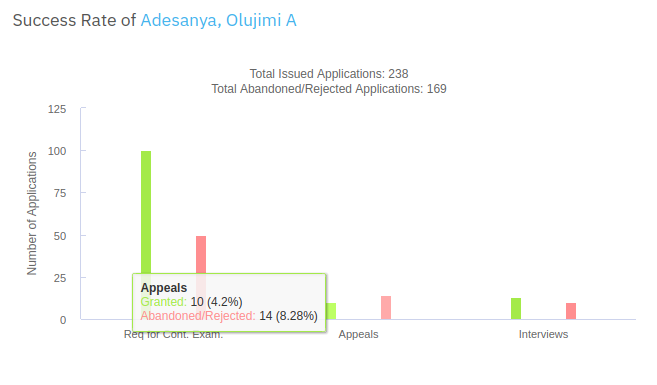
Fig 1.2
The stats are based on the historic data which can work as a guide for getting a patent in a shorter duration of time.
Deep dive into examiner history and predict the next possible events after rejections.
The FIT tool can also help decide the next possible events after the current rejection of an application.
In the below example, we can see the next possible events and its relevant probability for the examiner Adesanya, Olujimi A. There is a high chance this examiner will give a non-final rejection if the applicant has no idea how to proceed after this rejection and if the applicant follows the path suggested by our smart product FIT, they may get the patent-free of the rejection response loop.
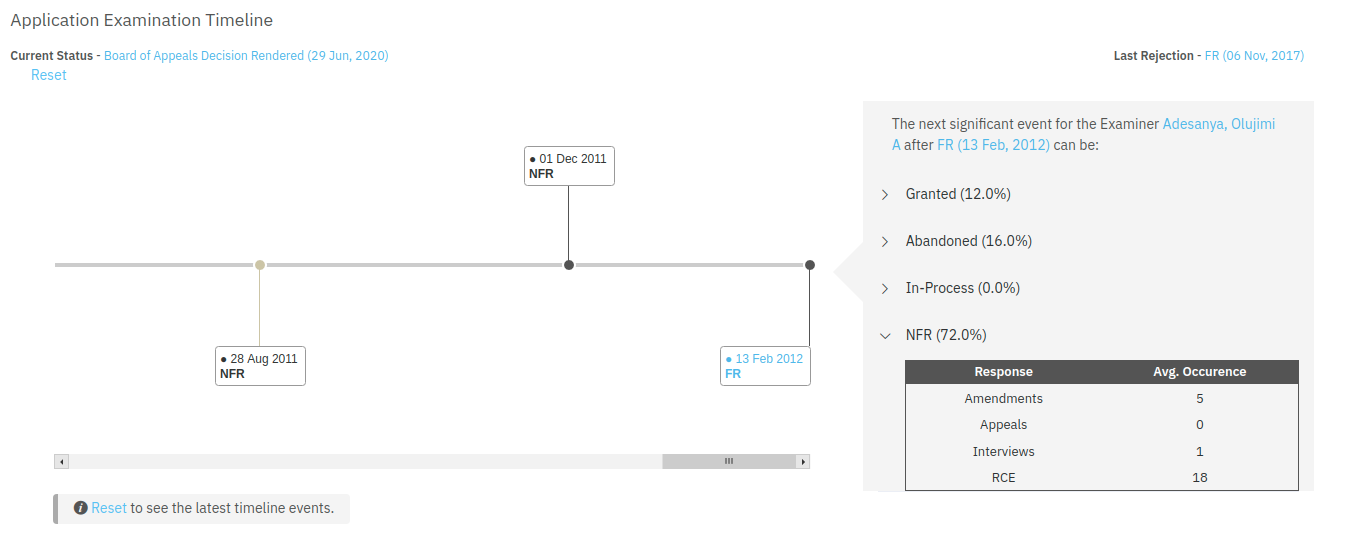
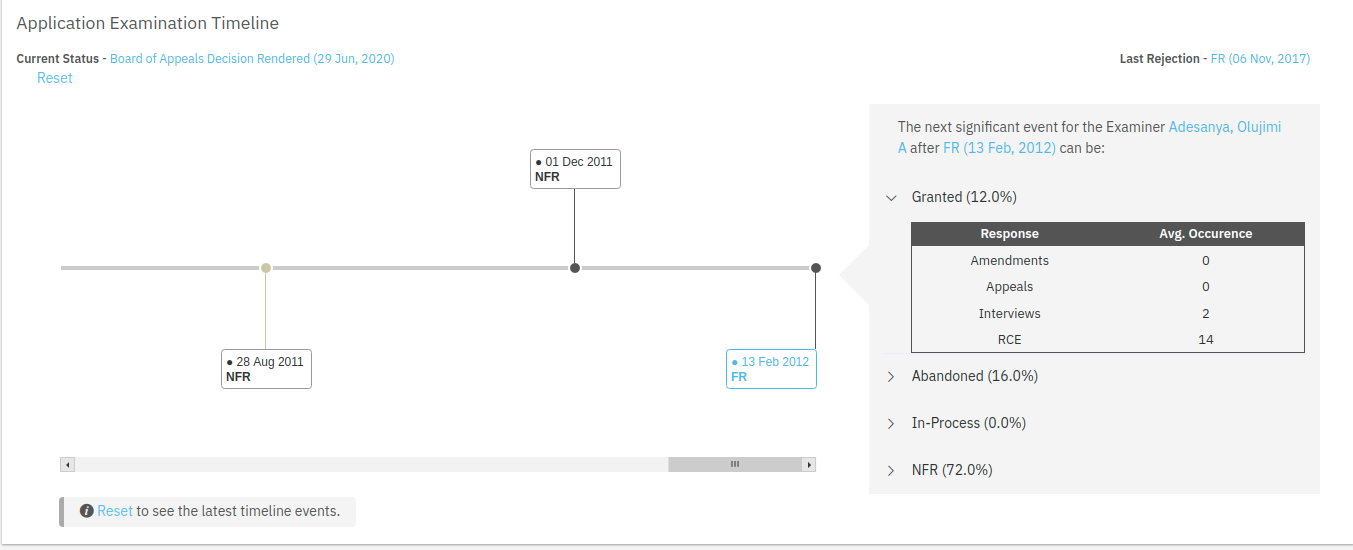
Perform a data-driven analysis as to which strategy is more beneficial than the other.
Going by that example, if you want your patent to get granted after Final rejection, the best strategy would be to request for an interview, as it has a high chance of getting a grant if you follow this route.
If you request for RCE, there is a 72% probability that the examiner gives NFR after the current rejection and you have to spend money to break this rejection and proceed further.
But if you follow the route suggested by FIT i.e the Interview there will be a high chance that you get a patent grant after this.
Conclusion
We understand patent prosecution is not as linear as it may seem from the outside. There are a lot of intrinsic parameters and board room calls that influence the patent filing from the backend. Our objective is not to make all this sound simple or something that can be done at a click of a button.
However, with the COVID-19 situation where everyone is getting sensitive about budgets, having custom products that can save you thousands of dollars at a fraction of cost is an option worth considering.
The Slate tool can give you better clarity about your prosecution process, suggest actions and strategies to break free of the rejection-response loop, smooth the prosecution process, and eventually save your budget in the long run.
Want to give this tool a try? Click this link and witness Slate at work.
Authored by: Vikash Raj Gupta, Product Development.