Companies often assume that if they spend big on research and development, it’s only a matter of time before they see a big return on investment in the form of new products with high marketplace value, and/or intellectual property that can be patented and monetized. But in many cases, things don’t work out that way. Would-be funders of valuable innovation routinely dedicate millions to R&D that produces no ROI at all.
In our experience working with some of the largest, most innovative companies in the world, a big part of the problem is that, however brilliant they are, the researchers in R&D departments often don’t understand the landscape in which they’re working. They frequently don’t know what products already exist, in what stage of development they might be, or who’s working on them. They don’t know how hot the market is for one tech sub-sector relative to others. Oftentimes, they haven’t even been provided with a framework to ensure that their research corresponds to the IP priorities, goals, and strategy of their employers—frequently because their employers aren’t sure themselves what their IP priorities, goals, and strategy should be.
The result of all this is that many R&D departments mostly end up generating ideas that don’t reflect their company’s core business and duplicating ideas that have already been patented—or coming up with new ones that are just plain bad.
In theory, the information (or at least telling clues) that would provide researchers with the intelligence that they need is publicly available in patent databases. Fine-grained analysis of large sets of patents can reveal up-to-the moment histories of technological development, as well as trends in innovation and marketplace demand. But R&D researchers don’t have the time or the know-how to sift through millions of patents. And even if they did, the dense, legalistic jargon in which patents are written would make their content difficult for researchers to comprehend.
As we’ve written previously, one approach to these problems is to enlist a patent research firm like GreyB to conduct regular patent landscape analyses, devising and tweaking R&D strategy based on the results. And for deep insights into of-the-moment innovative goings-on in a given tech or geographical area, there’s no substitute for an expertly performed patent landscape analysis. But a landscape analysis is static: a fine-grained snapshot, with a relatively short half-life. It’s an invaluable source of intelligence, but it’s not interactive. Researchers can’t ask it questions, change inputs, or shift its frame.
Over the years, we’ve found that to be effective—to use their time and energy to work on ideas and products with high profit potential while advancing their employers’ overall strategy. Many R&D departments need tools that allow them to understand the playing field for themselves on a day-to-day basis. They need resources that can help them decide what avenues of inquiry to pursue or abandon. In effect, they need a kind of auxiliary brain, equipped to provide in real time the data and analysis that they themselves don’t have the time or expertise to gather or produce.
In this article, we’ll describe a project we recently completed for a client with precisely those needs, resulting in a cutting-edge innovation guidance tool. A customizable software engine, the tool uses troves of up-to-date patent data to provide powerful search and analysis capabilities to researchers who think in terms of problems and solutions, rather than in the jargon that characterizes patent literature. This allows them to quickly understand the IP landscape with depth and clarity previously unavailable to them. Below, we’ll explain how, among other things, the innovation tool can help researchers:
- Verify whether an idea is truly new
- Monitor tech trends
- Identify innovative and economic hotspots
- Hunt for collaborative opportunities
- Find new players in their domain.
Above all, the tool helps ensure that R&D budgets don’t go down the tubes, keeping researchers on course to develop products and ideas that are genuinely novel, while taking advantage of marketplace trends and reflecting their company’s business goals.
We designed the software to meet the needs of a particular client. It’s not a plug-and-play tool. But it addresses a shortfall that plagues many companies, and GreyB can tailor the software to help optimize the IP strategy—and results—of most any firm, foundation, nonprofit, or even government institution. We believe that virtually any organization with a sizeable R&D department could benefit from its use.
Note: If you want to learn more about how GreyB can help optimize your company’s R&D department with innovation guidance software tools, you can contact us here.
Millions Spent on Enterprise R&D with Little ROI
Like many of the software tools we’ve developed at GreyB, this one grew out of a collaborative relationship with a client—in this case, a large foundation with an annual R&D budget of many millions of dollars that was facing a specific set of challenges. As it happened, these challenges were familiar to us. They much resembled those faced by many of our clients from the business world. Still, as ever, the devil was in the details.
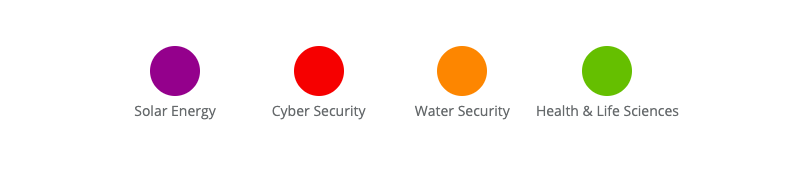
For several years, the foundation had been pouring resources into research and development in a handful of major categories: solar energy, health and life sciences, water security, cyber security. Like many of our corporate clients, the foundation had assumed that in return for the millions of dollars they were devoting to research, they would see bold, effective solutions and products coming out of their labs. They also assumed that these same solutions would result in profitable patents.
But that hadn’t happened. Instead, many of the researchers and scientists the foundation was funding seemed to be perpetually lost, spending their time—and the foundation’s money—pursuing dead ends, irrelevant threads, and generally failing to produce anything resembling meaningful ROI. In one case, to address safety concerns at stadiums, a researcher suggested creating an ejection mechanism, so that in the event of an emergency, people could eject themselves from their seats. Another stadium-related idea involved covering an open-air facility with transparent plastic sheeting, so that air conditioning would be more effective.
Of course, innovation is inevitably a process of trial and error, with numerous misses for every hit. But the researchers that the foundation was funding often seemed rudderless, with little hope of reaching on their own the kind of results their benefactors were hoping for.
The foundation’s directors were frustrated, but they were also dedicated to success. They wanted to do whatever they could to keep their researchers on course, directed toward their goals. And by the time they came to us, they’d identified a kind of sweet spot their researchers could aim for.
Figuring Out Where Institutional Goals and Marketplace Demand Overlap
To succeed, they believed, their researchers’ ideas would need to satisfy two key requirements:
- Overlap with one of the foundation’s areas of focus
- Zero in, within that area of focus, on an active sector of the market.
If the researchers could come up with ideas that matched these requirements, the foundation reasoned, they ought to end up with innovations that were both actionable and profitable.
Unfortunately, this wasn’t as straightforward as it sounded. The intelligence that the researchers needed—what was truly new and what was old hat, which researchers and companies were working on which ideas, what areas of the market were hot or cold—to keep them on track was out there, catalogued in patent databases. But like the corporate R&D researchers that we described earlier, those working for the foundation simply didn’t have the time or knowledge to navigate them or analyze their contents. In effect, for their purposes, it might as well not have been there at all.
It was almost as if there were trail maps that might have helped guide our client’s researchers to their ultimate goals. Only they were written in code that was, to them, indecipherable. If our tool was going to act as an auxiliary brain, it would have to negate that code, speaking in terms that the researchers could clearly understand. In other words, it would have to translate and reframe the language of patents—that densely technical, often virtually impenetrable legalese—so as to be legible to the researchers who needed the information it contained.
Designing an Interface to Reflect How Researchers Think
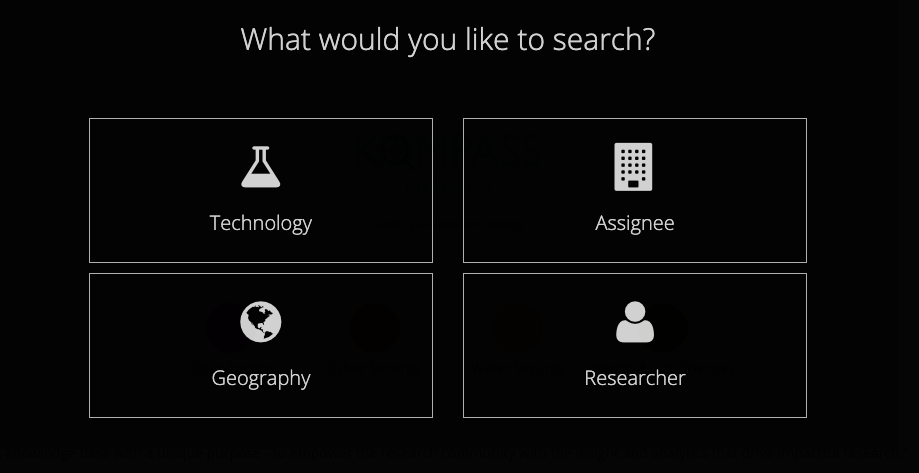
A key aspect of designing this software is that the foundation’s researchers were going to need an interface that mirrored the way(s) they themselves thought about their work and which allowed them to visualize the relevant patent landscape from a variety of angles. To begin with, we drew up a series of charts that broke down these modes of visualization into four basic “views”:
- Assignee
- Technology
- Researcher
- Geography.
Each view reflected a method that researchers could use to survey the IP landscape. If a researcher were interested in seeing what kind of innovations a company or university had patented—say, Google or Stanford—she could use the ‘Assignee’ view. Alternatively, if she wanted to see what was happening in a particular sector, she would use the ‘Technology’ view. If she’d heard a professor give an interesting talk at a conference and thought his work might shed light on her own research or provide inspiration, she might use the ‘Researcher’ view. If she were interested only in patents that had been filed in say, Asia, she could use the ‘Geography’ view to limit her search to that part of the world.
Whatever the case, the innovation guidance software would eliminate the obstacles that prevented researchers from drawing on patent literature directly—opaque jargon and odd descriptions, strange turns of phrase and the use of head-scratching synonyms—allowing them to think and speak in the kind of language that they already used to do their job. Of course, the four “views” were extremely broad. And we began breaking them down into subcategories: tech trends, publications, potential collaborative partners, geography, likely funding sources for research, associated researchers, and more.
In addition to providing researchers with an interface that reflected the way they thought, we knew the tool would have to emphasize our client’s innovative priorities:
- Overlap with one of the foundation’s areas of focus
- Emphasis, within that area, on an active sector of the market.
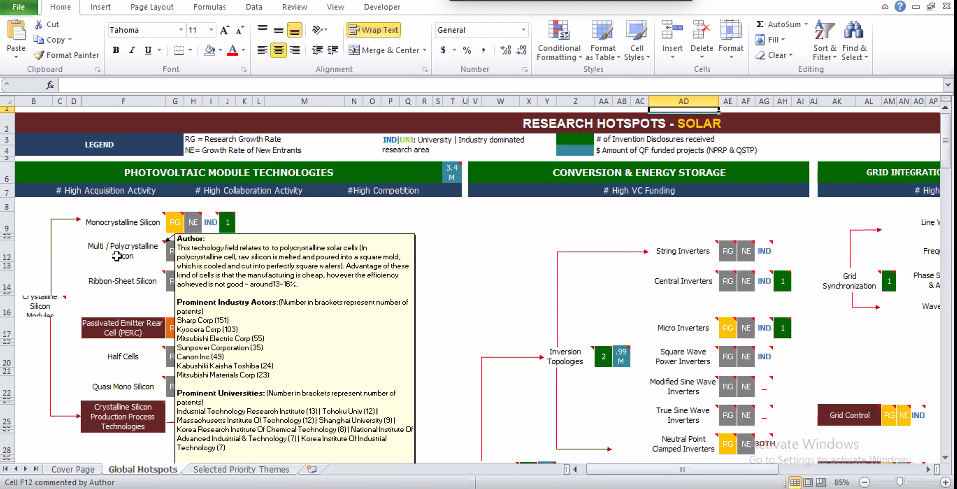
Below is an example of an early backend iteration of a search for solar energy-related patents, a priority theme for the foundation, which highlights subcategories representing hot areas of the market: photovoltaic module technologies, conversion and energy storage, grid integration.
The next step was to turn these charts into a dynamic interface — something that the foundation’s researchers could actually use to guide them to novel, profitable, patentable ideas and products. In the next section, we’ll walk through several iterations of a search, demonstrating how researchers can use the tool to identify fruitful areas of inquiry and guide their thinking down the most productive possible paths.
Putting the Finished Interface to Work
Below is the software’s home screen for our foundation client, indicating their four areas of innovative focus.
 Selecting any option will prompt the researcher to select a view:
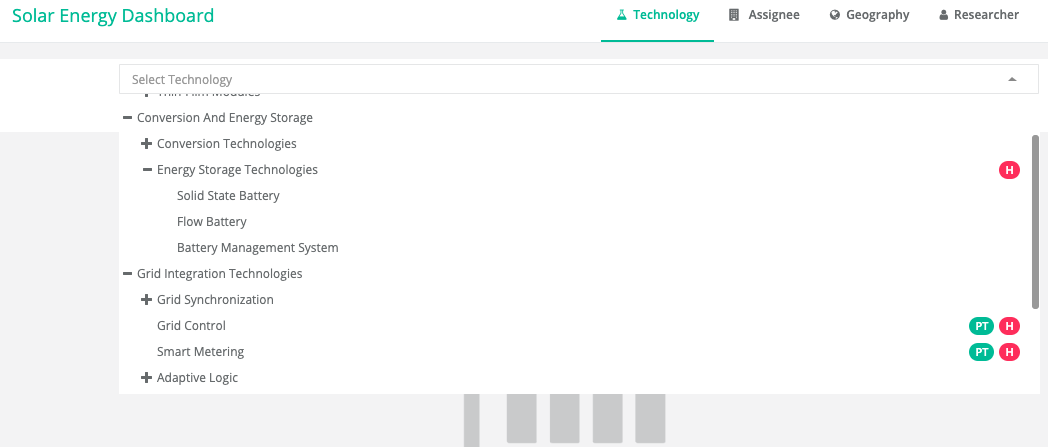
In keeping with our example from the previous section, the Solar Energy home screen appears below, in the ‘Technology’ view. From the dropdown menu, researchers can select subcategories. The red “H” icon indicates that a subcategory is a hotspot, while the turquoise “PH” icon indicates that it’s a priority for the foundation. (An “H” beside a “PH” suggests an area with especially good potential for research.) A “+” icon indicates the category can be expanded to show additional subcategories.
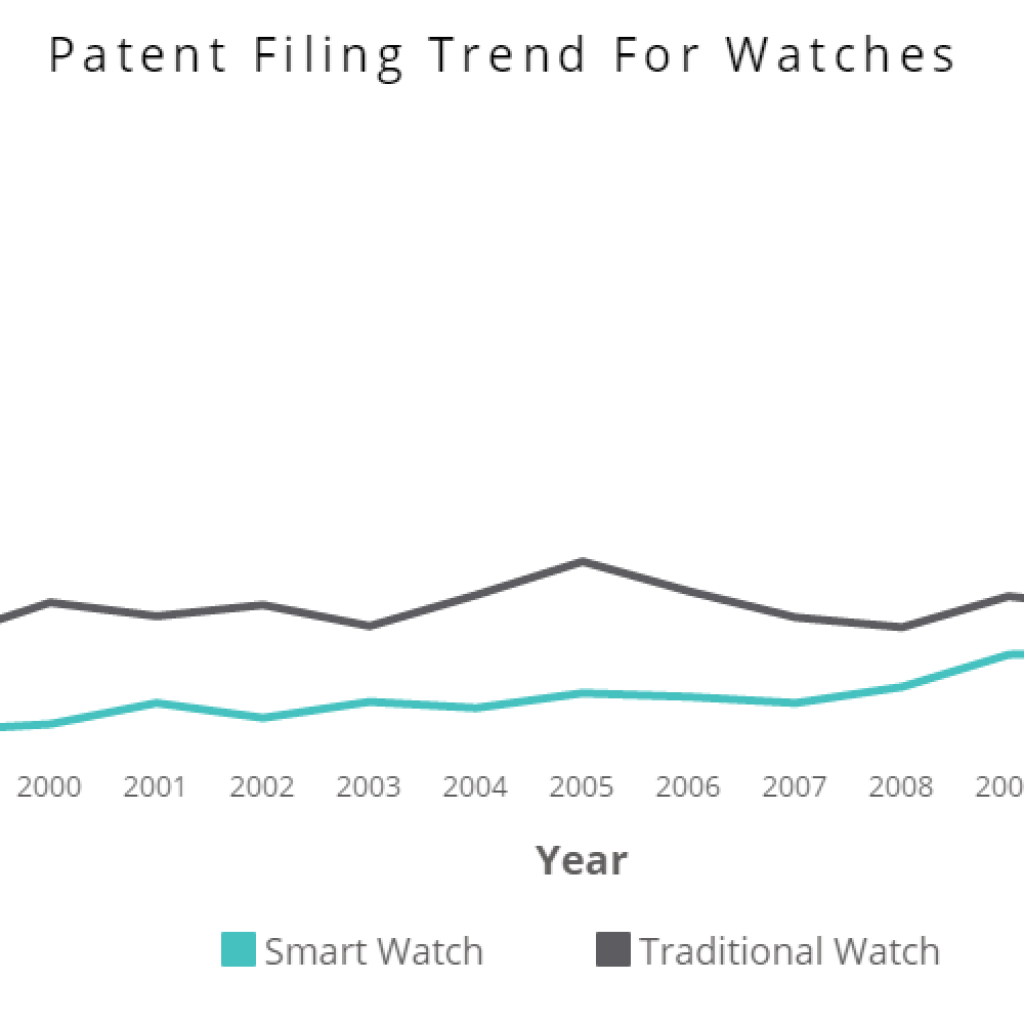
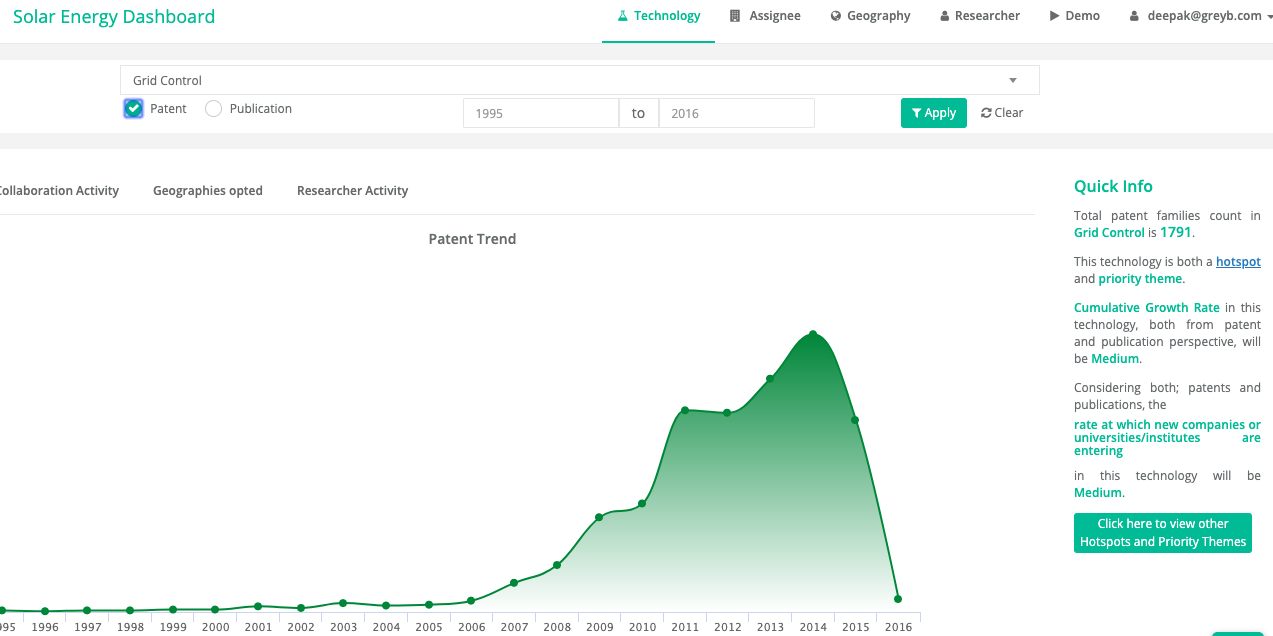
Below, a researcher has selected ‘Grid Control’, both a hotspot and a foundation priority, from the ‘Solar Energy’ dropdown. Within a given view, the ‘Overview’ tab shows historical patent filing trends for the selected date range. In this instance, a spike in new patents in recent years confirms this is a sector with strong likely ROI; the dip in 2016 is the result of pending data, rather than a drop in new patents.
(Researchers can also search for academic papers by checking the Publication, rather than the Patent box; they can quickly toggle, too, to the ‘Assignee’, ‘Geography’, or ‘Researcher’ views via links in the upper right corner of the screen.)
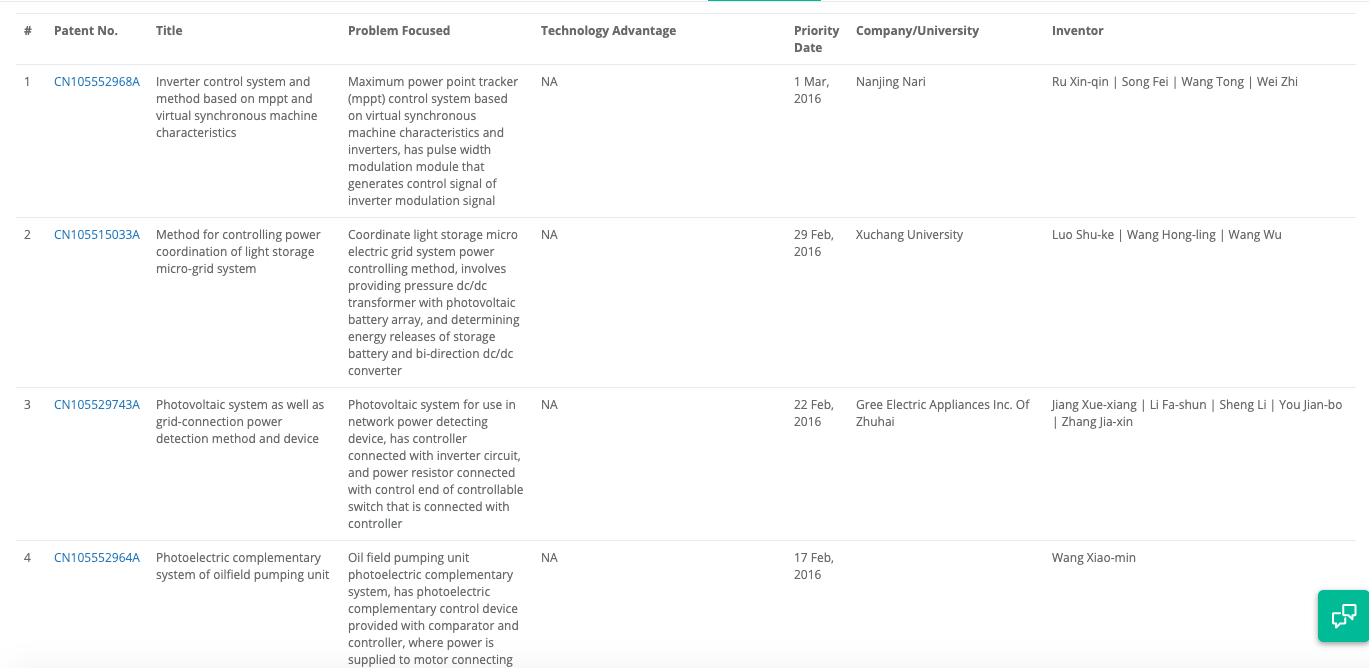
The researcher can scroll down to see a chart, complete with links to original documents, of the individual patents or publications returned by her search. Crucially, the chart describes each patent, in everyday terms, as a function of the problem it focuses on, reflecting the tendency of scientists, engineers, and inventors to think in terms of problems and solutions. That way, they can quickly determine whether or not a given patent is relevant to their work and decide to learn more or move on.
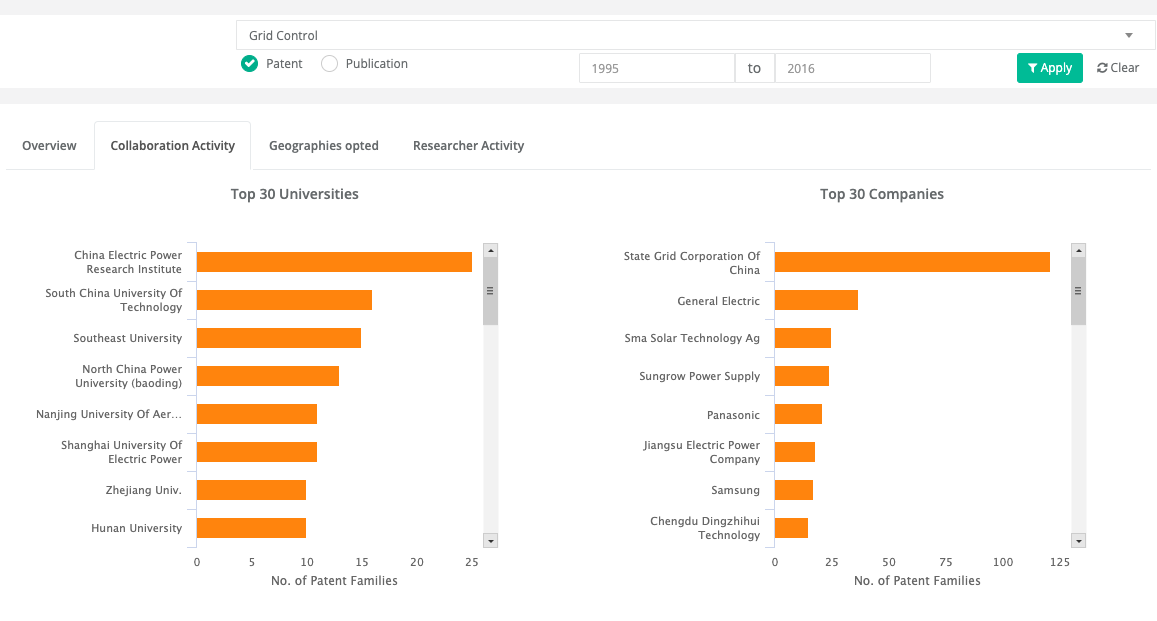
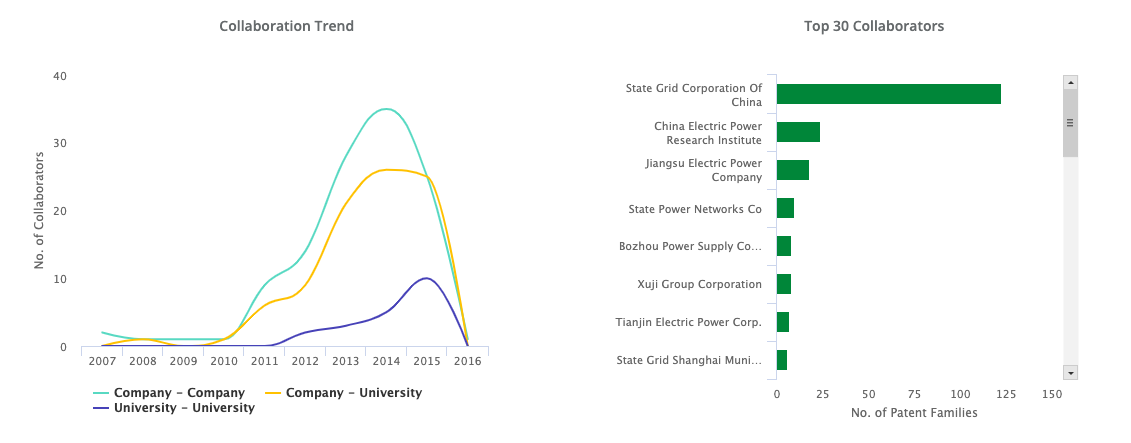
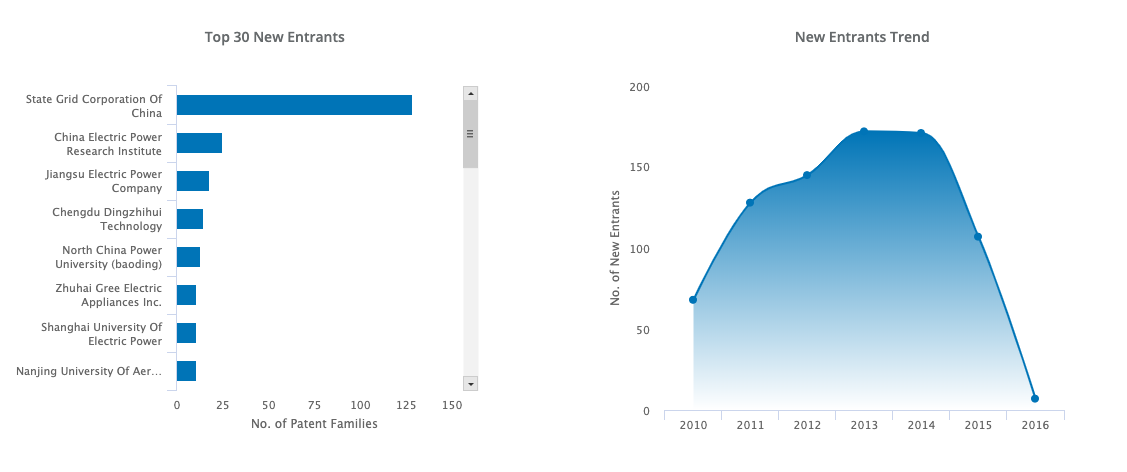
The ‘Collaboration Activity’ tab offers a rich, varied store of data, showing which universities and companies own the most patents in a given sector, which entities are most inclined to collaborate on research and with whom, as well as which companies and universities are new entrants to the field.
The presence of prominent schools and companies in the ‘Grid Control’ sector, as shown below, further suggests promising ROI for related research. Likewise the significant number of yearly new entrants. Researchers can also use this view to diagnose market conditions. If the number of patents is going up steadily but there are few new entrants, for example, the sector is likely headed for monopolistic conditions.
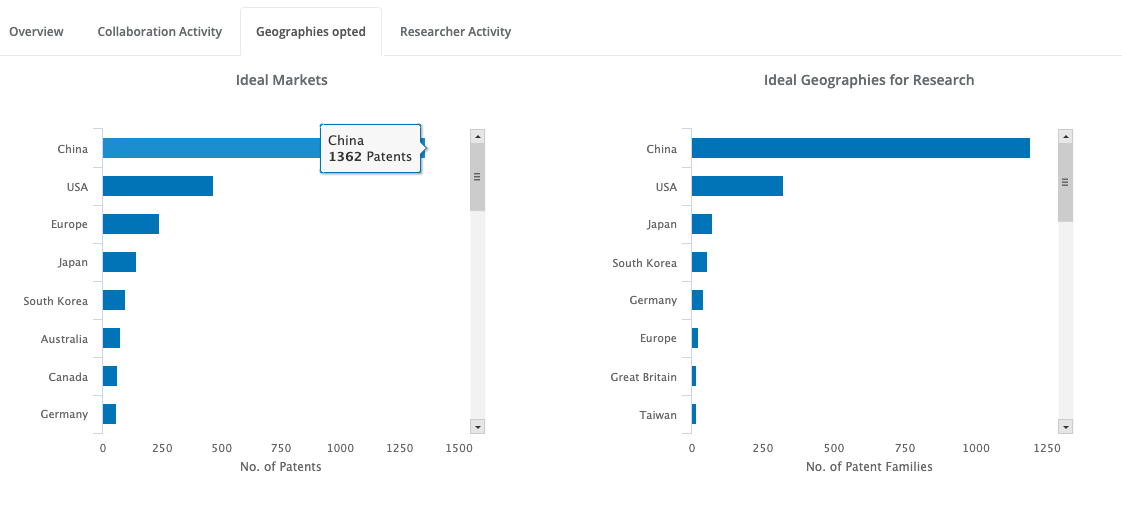
The ‘Geography’ tab shows researchers where the bulk of the tech sector’s patents have been granted, as well as ideal markets for new patents.
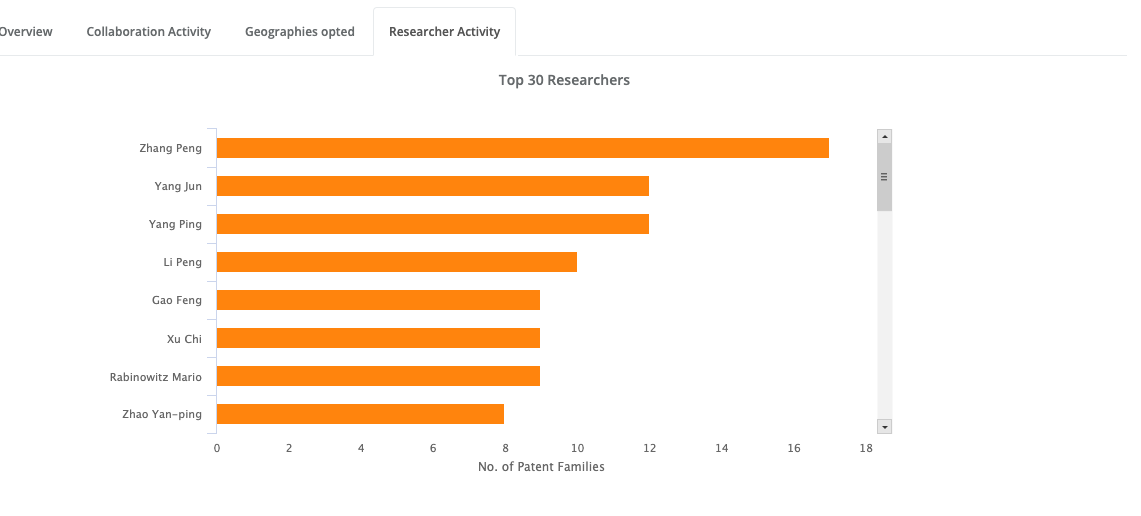
And with the ‘Researcher Activity’ tab, researchers can see who in the field has been the most productive, creative, and successful.
Is the Tool Right for You?
As we mentioned above, we designed this software for a specific client that was facing a specific set of challenges. It’s not out-of-the-box software; we created the tool to both reflect and strengthen precisely the way that the foundation’s researchers think. And that’s a big part of the reason it works so well, helping to ensure that the foundation’s R&D budget no longer goes down the tubes by keeping researchers on course to develop genuinely novel ideas while taking advantage of marketplace trends and reflecting the foundation’s big-picture goals.
At the same time, part of the reason GreyB was the proverbial right man for the job was that the obstacles the foundation was struggling with were extremely familiar. They were very much like those that many of our big corporate clients deal with. After all, most any firm with an active R&D department wants their researchers to understand the IP landscape with depth and clarity, and to make it as easy as possible for them to do things like monitor tech trends, identify hotspots, hunt for collaborative opportunities, and find new players in their domain.
By collaborating with GreyB, other companies, nonprofits, and even government institutions can create their own, highly customized interface to achieve results similar to the foundation’s.
If you want to learn more about how GreyB can help optimize your company’s R&D department with innovation guidance software tools, you can contact us here.