One key takeaway from the Patent Brokered Market Report 2023 is that buyers held the upper hand in 2023, which is expected to continue in 2024. Price drops, particularly when adjusted for inflation, create a buyer’s market.
However, the report also highlights the importance of sellers strategically pricing their assets based on a clear understanding of their value. To extract these insights, the report analyzed nearly 18,000 patent packages and 310,000 patent assets to provide insights to buyers and sellers.
Let’s take a closer look at these trends and more to understand the complexities of the 2023 patent market and what we can expect in 2024.
Market Size
While the Patent Brokered Market Report 2023 doesn’t explicitly state the total asking price for all tracked assets in 2023, it offers valuable insights into cumulative asking prices.
Figure 1 showcases a significant increase, with the cumulative asking price for tracked assets reaching approximately $45 billion.
Figure 1: Cumulative sum of asking prices – all deals ($ billion)
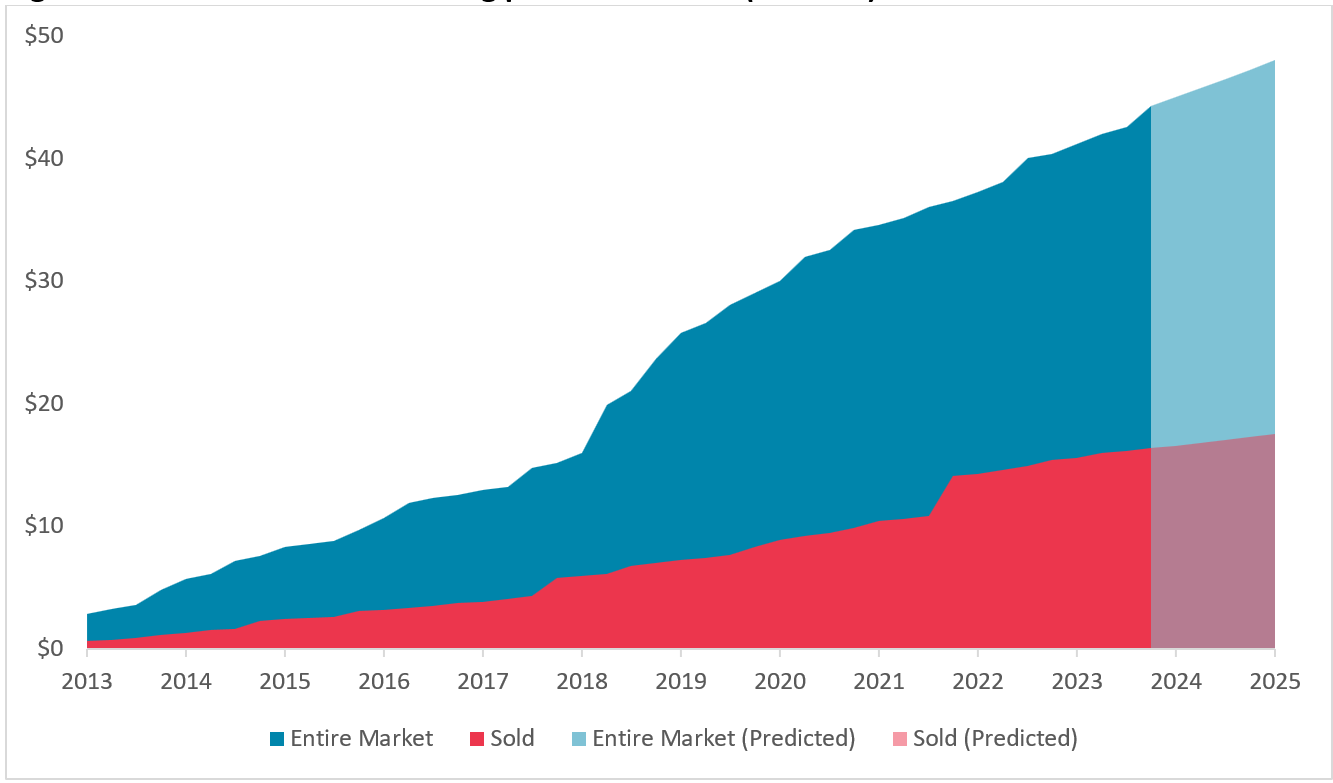
Apart from that, the total sales currently represent nearly $16 billion in asking prices. Extrapolating this trend, the report projects cumulative sales to surpass $17 billion by the first quarter of 2025.
It’s important to reiterate that these figures represent the sum of asking prices for sold packages without adjustments or discounts to reflect closing prices.
Patent Brokers
Remarkably, brokers have played a significant role in the sale of assets and have accounted for over 90% of the packages sold in the last five years.
As per the ROI Patent Brokered Market Report, here is a list of brokers who brought five or more packages to the market in 2023.
Table 1 – Brokers with five or more packages in 2023
| Adapt IP Ventures |
| Blackhawk Technologies |
| Dynamic IP Deals |
| ICAP |
| IP Approach |
| IP Offerings |
| IP Pioneer Group |
| IPInvestments Group |
| Iceberg |
| Ocean Tomo |
| Red Chalk Group |
| Rowan TELS |
| Tangible IP |
| TransactionsIP |
| Vitek Intellectual Property |
Packages
While the overall number of packages listed for sale dipped slightly in 2023 compared to 2022, there’s a noteworthy detail – a rise in the number of US-issued patents. The report acknowledges it’s too early to confirm if this is a sustained trend, but it highlights a potential shift in the market composition.
Table 2 provides a three-year comparison of package and asset counts, showing this fluctuation.
| 2021 | 2022 | 2023 | % Difference | |
| Count of packages | 1,238 | 1,934 | 1,639 | -15% |
| Number of issued US patents | 9,287 | 12,808 | 17,203 | 34% |
| Number of assets | 19,243 | 29,360 | 28,622 | -3% |
There are opportunities for buyers seeking patents across various industries, from software to hardware and everything in between. This diversity allows companies to address risk mitigation strategies and other business needs within specific technological areas.
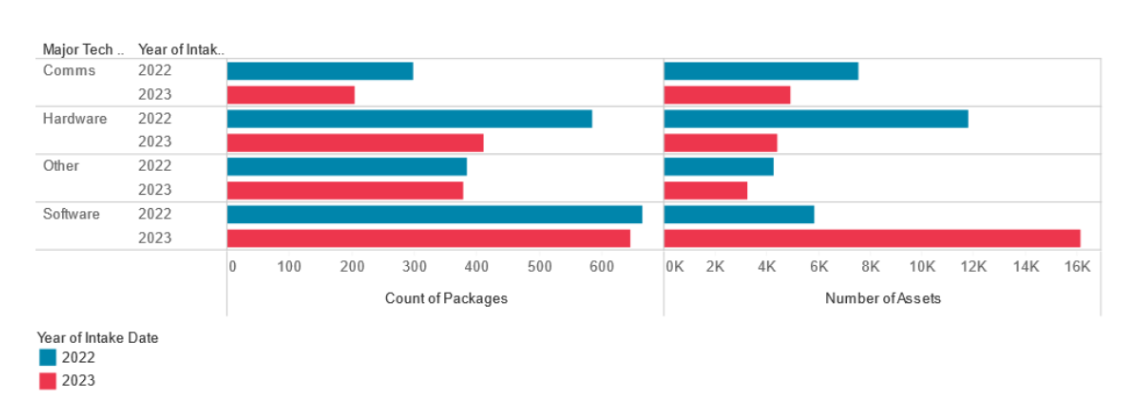
The report further reveals that software-related patents dominate the market, as depicted in Figure 2. However, there’s a noteworthy trend – a pullback in communications and hardware packages, particularly regarding the number of assets offered. Interestingly, software patents tend to sell better than those in other categories.
The “other” category encompasses patents related to medical devices, automotive, and energy sectors.
Figure 2: Package distribution by technology group
Pricing
Patent pricing is complex, like pricing in any industry. A patent’s value for the seller might differ significantly from what a buyer is willing to pay.
As per the ROI Patent Brokered Market Report 2023, the median asking price per asset dropped from $143,000 in 2021 to $106,000 in 2022, the lowest price in the past five years, but came back to $125,000 in 2023. This trend suggests a buyer’s market, with potentially more negotiating power for companies and organizations seeking patents.
When adjusted for inflation, the decline in median asking prices becomes even more stark. Inflation in the US from 2020 to 2023 was about 19%. With this adjustment, the median asking prices in 2020 and 2021 were about 40% higher than in 2023. This suggests that patent prices are not keeping pace with inflation.
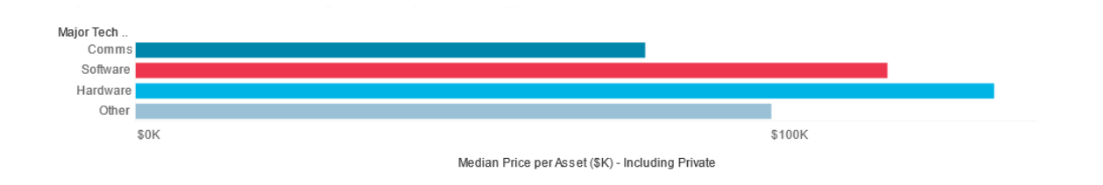
Regarding the highest asking prices by tech category, the “other” category, encompassing patents in medical devices, automotive, and energy, has historically seen rising asking prices. In 2021, it even surpassed software as the most expensive category, although it has since receded.
Software patents, as seen in Figure 3, are again below hardware this year, and communication technology patents have also shown a decrease in asking price relative to other categories.
Figure 3: Distribution of asking prices by technology
Asking Price and the Impact of EOUs
Sellers can showcase the high value of their patent package by demonstrating its practical application. This can be achieved through “evidence of use” documentation, such as claim charts illustrating infringement.
Strong claim charts not only illuminate a patent’s value to potential buyers but can also bolster your position in negotiations or litigation.
Craft Winning Claim Charts and Avoid Costly Mistakes by contacting our IP experts.
Over the last five years, substantial pricing premiums for packages with evidence-of-use documents ranged from 32% to 108% higher. While the overall percentage of deals with evidence of use has remained steady at around 29% in 2023, the impact on price can vary significantly.
Sales
Similar to the ROI Patent Brokered Report’s approach with pricing data, a timeframe is required for accurate sales trend analysis. For this reason, packages that have recently entered the market are typically excluded from the analysis, giving them at least a full year to be listed before incorporating them into sales rate calculations. This reflects the reality that patent sales often take time to materialize.
Focusing on listings and sales from 2018 to 2022, the sales rates typically surpass 30% of all packages listed in a given year. This signifies that most packages eventually reach a 30% sales mark over time. For instance, packages first listed in 2018 are nearing a 30% sales rate, demonstrating that even older patents can find buyers.
Sellers
For a buyer, tracking the seller’s behavior, both in aggregate and individually, allows for operationalizing the buying activities. Knowing who is willing to sell and the type of assets available allows one to review listings faster and presents the opportunity to make a direct approach for a private deal.
The above holds true, especially for repeat sellers, who account for more than 40% of package transactions in any given listing year.
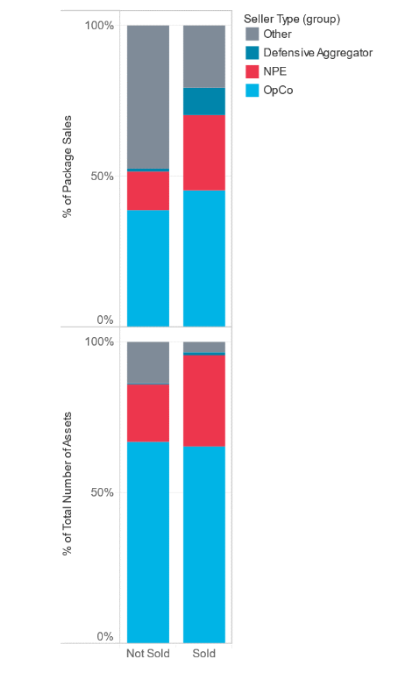
Figure 4 depicts the distribution of seller types across the 2018-2022 timeframe. On average, between 40% and over 60% of the packages and assets originated from operating companies. This is unsurprising, considering operating companies file the most patents.
Figure 4: Distribution of seller type
Buyers
Patent buyers consider patents to be an asset with significant potential benefits in the future. The acquired patents can mitigate potential risks, support new technology, counteract legal action by competitors, or earn money through licensing. In essence, buyers are making a calculated investment, believing the long-term value of the patents will outweigh the purchase price.
Figure 5 highlights an interesting trend regarding buyer types. Operating companies are the primary purchasers, acquiring an average of 25% to over 45% of patent packages and a significant share of individual assets (40% to 75%). Non-practicing entities (NPEs), while buying fewer packages (20% to 50%), acquire a substantial portion of the individual assets themselves (15% to 50%).
Figure 5: Distribution of Buyer Type
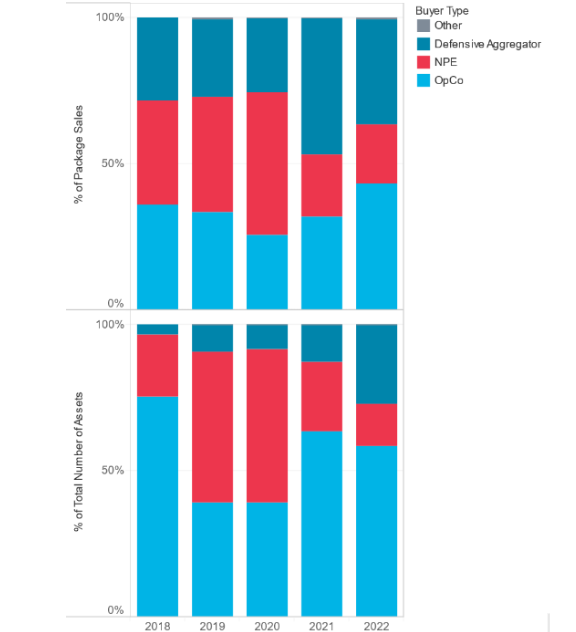
Since operating companies are divesting more assets than NPEs are acquiring, this suggests a potential shift in the patent market. There appears to be a flow of assets moving from operating companies to NPEs.
As a result of this movement of assets, there will be significant implications for businesses.
Therefore, if you are concerned about staying ahead of potential litigation in your domain or perhaps want to gain insights into which assets NPEs are acquiring within your industry, fill in the form below:
Our patent experts can help you:
- Proactively monitor litigation trends to identify potential threats within your domain.
- Gain insights into NPE buying habits to understand their focus areas within your industry.
- Develop a strategic patent portfolio to mitigate risk and maximize value.
Litigation
The presence of a patent on the brokered market inherently introduces litigation risk. By listing a patent for sale, the seller expresses their intent to monetize it, which can incentivize litigation as a potential means of achieving that goal. Patents sold to Non-Practicing Entities (NPEs) are particularly susceptible to litigation, but even unsold patents carry an elevated risk.
Packages sold to NPEs experience the highest litigation rates, with 30% to 45% facing at least one lawsuit. These numbers are anticipated to rise for 2023 as additional cases unfold. It’s important to note that these figures exclude assertions settled through licensing agreements before litigation begins.
While litigation rates for listed patents are considerably higher than the general population, they are not as high as expected. Over half (over 50%) of packages sold to NPEs do not experience litigation. This is partly due to some prominent NPE buyers prioritizing licensing agreements over immediate litigation. For instance, both VideoLabs and IPValue are known for attempting to secure licenses before resorting to lawsuits.
Full Market Size
This year’s patent-brokered market report has a revised methodology for estimating the patent market size. The previous methodology relied on predictions, whereas the new approach focuses on actual data.
The data reveals significant variation using the new methodology, with 2020 and 2021 appearing considerably larger.
An examination of actual sales data shows that just a few large deals in a given year can significantly influence the overall market size. For instance, four large deals in 2020 contributed to 41% of the market, while five deals in 2021 accounted for 32%. Therefore, much of the variation likely stems from the timing of these large transactions.
Opportunities, Insights, and Reflections
For Buyers: A Buyer’s Market
The good news for buyers is that this remains a buyer’s market, with no anticipated changes in 2024. Inflation-adjusted prices continue to decline, and tech industry layoffs and budget cuts are fueling an influx of patents into the market. This presents a vast pool of patents for buyers seeking to fill specific needs or bolster their defensive strategies against potential litigation.
For Sellers: Quality, Clarity, and Confidence
Despite the buyer’s market, quality assets continue to sell. Sellers who provide claim charts and documents mapping a patent’s claims to specific technology features experience higher close rates and are more likely to sell their patents.
Litigation Landscape: Focus on the Market
Litigation rates for patents offered for sale are significantly higher than for other patents. By monitoring the patent market in 2024, stakeholders can gain valuable insights into:
- The types of patents most susceptible to litigation.
- The kinds of patents favored by NPEs for litigation.
- The patents corporations use for countersuits in litigation scenarios.
How can GreyB help?
The 2023 Richardson Oliver Insights Brokered Patent Market Report paints a clear picture: it’s a buyer’s market, and Non-Practicing Entities (NPEs) are seizing the moment. This report serves as an invaluable resource for anyone considering entering the patent market, offering crucial insights to make strategic decisions.
However, even in a buyer’s market, accurately determining the true value of patents remains paramount, whether you’re buying or selling.
This is where GreyB comes in, with over a decade of technical and manual experience in the world of IP to provide a comprehensive suite of solutions:
- Patent portfolio analysis and smart planning in case of a licensing demand or lawsuit from an NPE;
- Deeper analysis of competitors’ and the general ecosystem’s licensing and sales activities;
- Bifurcating patent assets and identifying gold ones to sell (Sometimes identifying good patents and keeping those rather than abandoning them is the key task; read more);
- Curating a list of viable sellers and buyers (Check out our list of patent brokers and marketplaces to buy and sell patents)
- Filtering through patents and identifying important ones, focusing on their claims. This is vital as it lets buyers focus on the most critical parts of a package first and
- Developing evidence of use (EOU) materials. (Read our documented thoughts on what makes good EOUs here and here)
Get in touch to ensure you know the value of the patents you hold or plan to acquire.
Authored By: Annie Sharma, Marketing Team