I wanted to share something interesting our teammate Mahesh found while working on an internal 3GPP search tool.
“There was a factory worker who was employed to quality test the manufactured parts. His job was simple. He had to use a vernier caliper to measure the diameter of every manufactured part that came out of the assembly line.
His instruction was then to record the diameter of every part in a logbook and if it was below 3.00 cm, then reject this part.
The data he had accumulated over time was once given to a production engineer for analysis. He plotted the distribution and found something remarkable.
The plot looked like this:
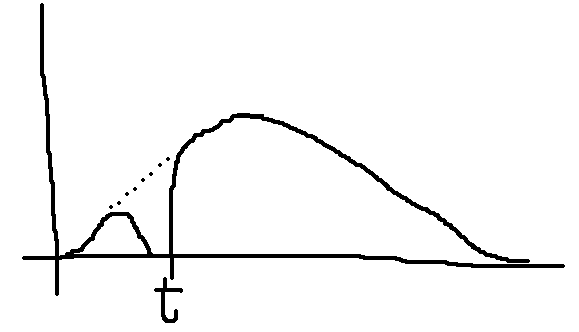
It seemed the machine was producing parts above 3 cm and below 2.95 cm but wasn’t producing ANY parts between the 2.95 to 3.00 cm range!
Of course, it wasn’t the case. The machine was working parts of all dimensions, it’s just that the worker was “passing” any parts in the missing range, perhaps thinking “close enough” 😀
Most naturally occurring measurements in the real world produce a nice “bell curve” when their distribution is plotted.
But how is it relevant to us?
Suppose I want to look for 3GPP documents that talk about a mobile terminal going into standby. And I run this query “terminal? S stand_by” (just an example)
I get this distribution in 3GPP search:
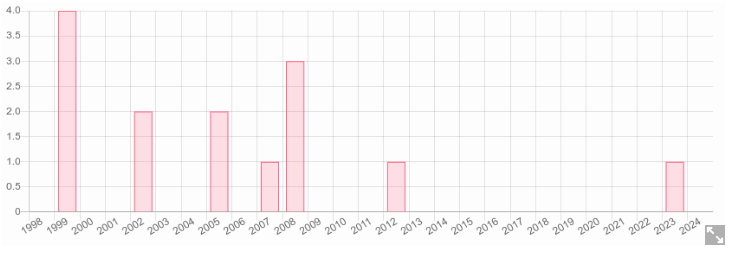
You see the problem? This isn’t a “natural” distribution.
This is an indication that I have to improve the query to capture all variations of this concept.
Now I also put in the following keywords for standby: stand_by sleep* inactive hibernate*
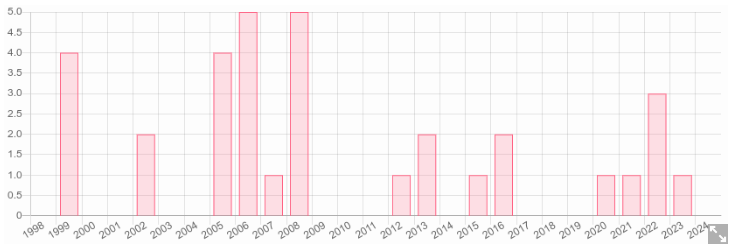
Slightly better, but still not there:
Let’s also add synonyms for terminal: terminal? UE? equipment? device? portable? handheld mobile and set a cut-off date of 2019.
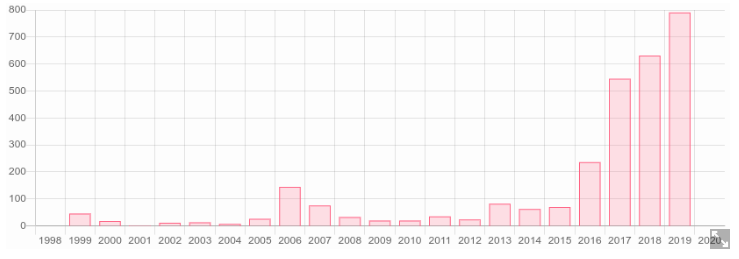
Now we see the “ebbs and flows” of this concept as it was discussed in the context of 2G, then 3G, then 4G and 5G.”