Across the U.S., academic tech transfer is under strain. In 2023, U.S. institutions reported a 33% year-over-year decline in patent licenses.
Meanwhile, unused patents keep costing money. Utility patents require three maintenance payments at 3.5/7.5/11.5 years. After the 2025 fee changes, large-entity fees total $14,470 ($2,150 + $4,040 + $8,280). Small-entity nonprofits (which include many universities) pay $7,235 in total.
The result: a sizable pool of campus IP that remains unlicensed, much of it becoming a liability. Prior research has even estimated that about 65% of invention disclosures go unlicensed in a typical year, while institutions still shoulder portfolio costs.
Against this backdrop, Aven, patent counsel for a U.S. university, found herself racing against time. It’s year-end, and she finds herself under intense pressure.
Several high-value patents in the university’s portfolio were approaching maintenance deadlines. The leadership was pressing for measurable progress in tech transfer outcomes. Despite managing an extensive and diverse set of inventions, only a fraction had attracted commercial interest.
The pressure to justify renewal costs and prove the portfolio’s real-world value was mounting. Aven needed to identify large companies that could see tangible potential in these patents and be persuaded to license them. But to make that case convincingly, she needed data-backed research that could connect the university’s innovations to real market needs.
Also Read:
A Portfolio Without a Path
When we began analyzing the university’s patent portfolio, it became clear that the challenge wasn’t a lack of innovation; it was the fragmentation of that innovation.
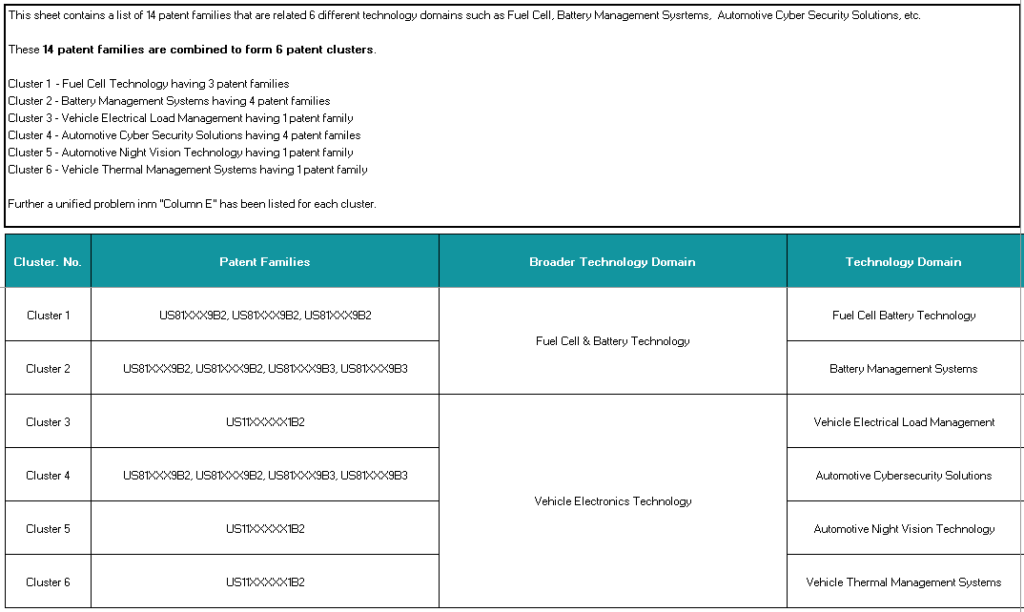
The university had 14 active patent families spanning six highly specialized technology areas. Each patent seemed valuable on its own, but together, they told no cohesive story.
Our first goal was to find a common thread to see the portfolio not as a list of inventions, but as a map of problems the university was trying to solve. We started by compiling all available documentation: patent summaries, claim charts, inventor disclosures, and related research abstracts. The claim charts, in particular, became our roadmap.
Also Read:
Instead of merely summarizing claims, the claim charts illustrated something far more vital: they showed the gaps in existing products that the university’s patents could fill. These weren’t just theoretical solutions; they were answers to specific, real-world problems in the marketplace. For example, a claim chart for a fuel cell patent revealed a flaw in current systems, conversion efficiency, that several large energy companies were struggling to improve.
This insight was crucial. The charts weren’t just identifying what the patents did; they were highlighting exactly where they could address existing challenges in product performance. In other words, these charts showed us the “loopholes” in current products that the university’s patents could solve.
What emerged was a pattern. Several patents addressed challenges in energy storage, conversion efficiency, and hybrid system control. Others focused on electronic communication, sensors, and vehicle circuitry. Rather than viewing them as isolated cases, we realized they naturally converged around two commercial narratives.
- Fuel Cell & Battery Technologies
- Vehicle Electronics Systems
Grouping the fourteen patent families into these two clusters transformed the way the portfolio could be read. Instead of a scatter of isolated ideas, it now resembled two well-defined domains with distinct industry relevance.
Building the Research Model
The starting point Once we had identified the gaps that the university’s patents could fill, the next step was to find companies actively working on solutions for those very challenges. Time was of the essence. We knew that targeting the right companies could accelerate the tech transfer process.
To do this, we created a Level 1 and Level 2 shortlisting framework.
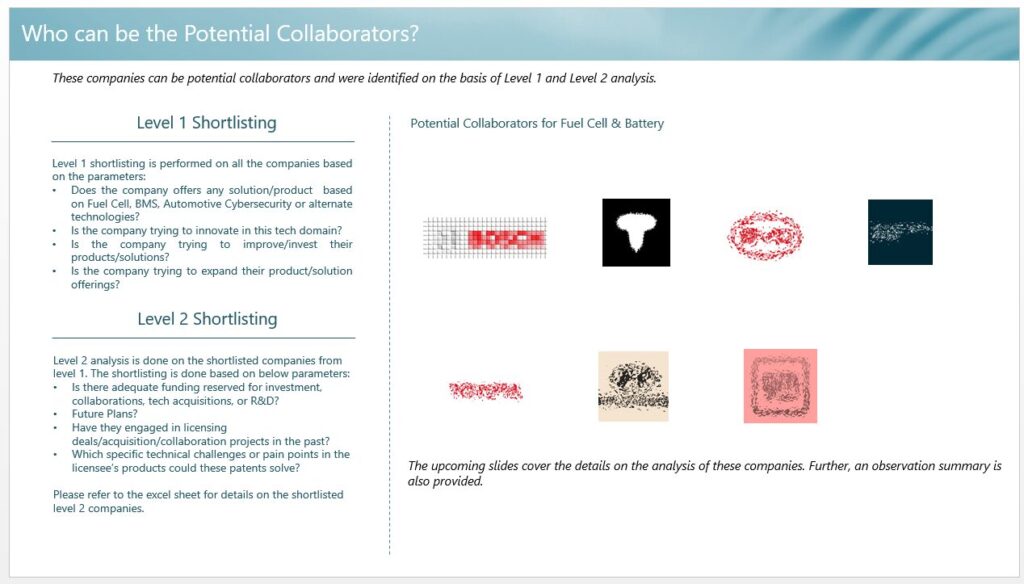
The starting point was the creation of a Level 1 and Level 2 shortlisting framework. Each level served a distinct purpose. Level 1 looked broadly at the industry landscape to ensure we weren’t missing emerging or adjacent players. Companies were first screened based on:
- Whether they currently offer any product or solution in the target domains (Fuel Cell, Battery Systems, Automotive Electronics).
- Ongoing innovation activity within these domains is identified through patent filings and R&D news.
- Evidence of expansion, companies actively investing in new solutions or product lines related to the clustered technologies.
At this stage, open-source and subscription-based databases were used to gather structured intelligence. Patent activity was mapped through tools such as Orbit Intelligence and Derwent Innovation. At the same time, product and R&D developments were tracked via company websites, press releases, investor presentations, and technology media databases such as Crunchbase, PitchBook, and PR Newswire.
The outcome of this phase was a Level 1 shortlist of 26 companies.
Deep-Level Validation and Filtering
Level 2 analysis was built on a foundation that narrowed the focus to companies that not only operated in relevant domains but also demonstrated strategic readiness for collaboration. This wasn’t just about finding companies in the right sector; it was about ensuring they had specific product gaps, or “loopholes”, that the university’s patents could fill.
Here, we evaluated:
- Acquisition or partnership trends: whether the company had a history of acquiring or licensing external technologies.
- Future-facing R&D investments: announcements related to pilot programs, demonstration projects, or new research facilities.
- Technology-pain alignment: matching specific pain points in their roadmap with the problems solved by the university’s patents.
The claim charts played a crucial role in this stage. Instead of merely analyzing patents, the charts allowed us to identify product gaps, the specific areas in companies’ existing or upcoming products where the university’s patents could provide solutions.
For instance, we identified a significant energy-conversion efficiency issue in one company’s battery systems that aligned with a university patent. Each company’s product pipeline was assessed through analyst reports, annual filings, and technical white papers. Where available, patent-to-product cross-references were used to identify areas of direct functional overlap, where the university’s patents could fill gaps in the companies’ offerings.
This process ensured that potential licensees weren’t just operating in the right space; they were facing the specific challenges that the university’s patents were designed to solve.
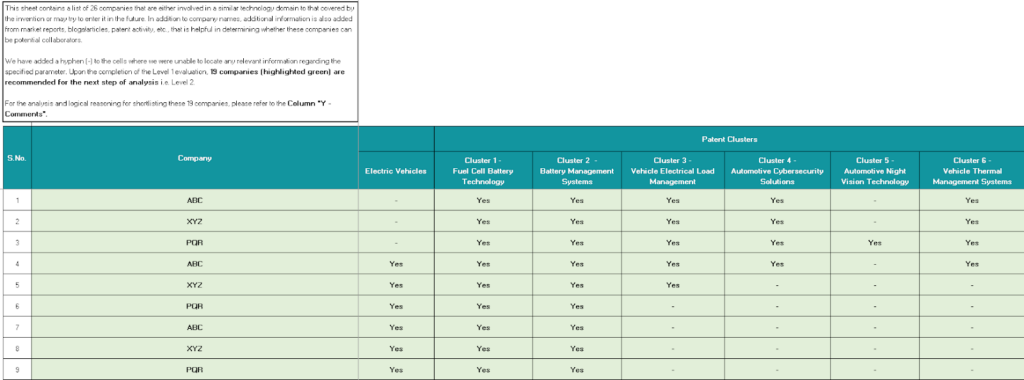
Level 2 segregation reduced the pool to 19 high-potential candidates, each exhibiting at least one measurable synergy with the university’s clusters, and each having a clear gap or “loophole” that the patents could fill.
Final Shortlisting and Validation
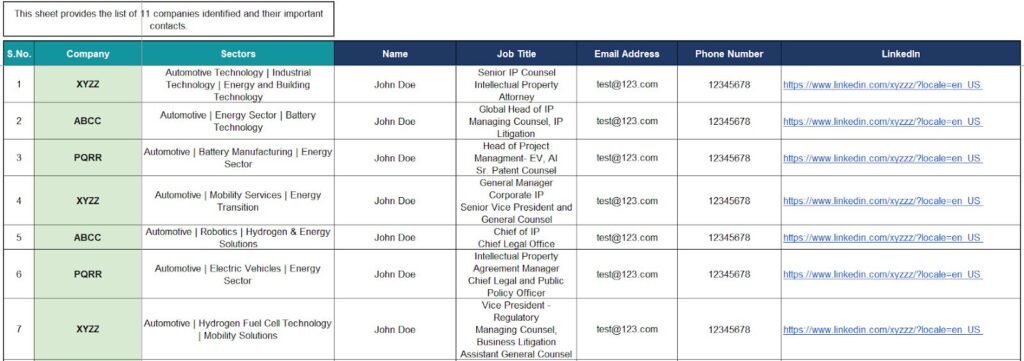
A more granular comparison was then undertaken to ensure market and technical alignment. We evaluated technology overlap, strategic fit, and market readiness, using a combination of weighted scoring and manual validation. The result was a final shortlist of 11 companies: seven operating in Fuel Cell & Battery Technology and four in Vehicle Electronics.
The verification process was supported by an internal mapping matrix, where each company was cross-referenced against specific patent clusters. This ensured every shortlisted candidate was backed by clear evidence of relevance, such as:
- Shared technology keywords and patent claim similarities.
- Product releases or prototypes aligning with university inventions.
- Statements of focus on next-generation energy systems, vehicle electrification, or smart mobility.
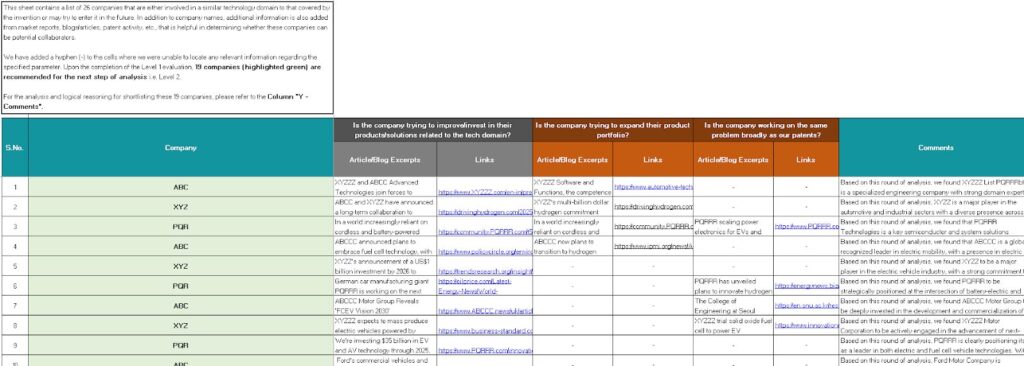
The visualization sheet in the dataset shows how each shortlisted company aligns with specific clusters, providing a transparent audit trail for every inclusion.
Creating Outreach-Ready Material
While identifying a list of potential companies was a crucial first step, it wasn’t enough to move the university’s tech-transfer efforts forward. To transform the analysis into actionable outcomes, we developed company-specific briefing decks titled “University’s Patent Portfolio Relevance to [Company Name].”
These decks were designed to present the university’s patents in a way that demonstrated their strategic value to each company. Rather than just listing patents, each deck clearly showed how the university’s technologies could address specific challenges or gaps in the company’s current or future product offerings. This approach ensured that the outreach wasn’t just about selling patents but about solving problems that were relevant to the companies.
Each deck consolidated:
- Patent application scenarios, illustrating how the university’s technologies could directly address specific gaps or enhance a company’s existing technologies or product development roadmap.
- Use-case scenarios, highlighting practical, commercial applications for the patents, making it clear how the technologies could be integrated into existing business strategies and drive value.
- Compelling value propositions, emphasizing cost efficiency, performance improvements, or sustainability advantages that the university’s innovations could bring to the company’s operations.
- Targeted decision-maker contacts, gathered through LinkedIn Sales Navigator and corporate filings, to ensure that outreach was direct and effective, ensuring the right people were engaged at the right time.
This approach ensured that the university’s patents weren’t just presented as stand-alone assets; instead, they were framed as key solutions that could bring tangible benefits to each company. The tailored, strategic decks set the stage for meaningful, high-quality outreach.
Aven Had a Roadmap to License Her University’s Dormant Assets
In the end, Aven had more than just a list of prospects; she had a clear path forward. Our research identified 11 companies with both the strategic alignment and technical capability to benefit from the university’s patents. Each target was supported by a customized presentation deck that illustrated how specific patents could strengthen or complement their existing product lines.
Beyond the immediate outreach plan, Aven also gained a repeatable mapping framework. It was a system her team could use to cluster patents and identify future licensing opportunities internally. What began as a pressure-filled challenge transformed into a data-driven roadmap for long-term, sustainable tech transfer success.
Conclusion
Every university and research institution holds patents that could shape the future, but too often, they remain just that: patents.
With structured analysis, focused scouting, and evidence-backed storytelling, it’s possible to connect patents with the companies that need them most.
Like Aven, many organizations have strong IP portfolios but limited visibility into who might need them. If you believe some of your patents hold hidden value or simply want to know which assets deserve a second look, our team is here to help.
Request a Monetization Potential Scan below, and we’ll help you uncover high-value opportunities and connect with potential licensees.
Not sure which patents could bring real returns?
Find companies ready to license your assets.

