


John, a partner at a well-established patent litigation firm in the United States, contacted us at a point when the pressure had started to build. He was preparing for a patent infringement case involving a tech that described a multi-camera imaging system capable of producing an image with a sharply focused center and a lower-resolution outer region. On paper, the claims were clear and well-constructed. But despite months of effort, the evidence to support them was missing.
The invention had originated in a robotics research lab. Its structure, language, and intended function aligned with robotic vision systems, especially those used in spatial mapping or environment-aware navigation. Following what seemed like the most rational path, John had directed his team toward robotics and automotive industries, where multi-camera systems are a known staple.
No posts found.For nearly three months, his team stayed deep in technical literature. They studied datasheets, teardown reports, product manuals, and academic papers. They pieced together hardware configurations, mapped sensor layouts, and cross-checked product announcements. Every lead seemed promising, until it wasn’t.
Time kept slipping, but the breakthrough never came.
The search had consumed a significant portion of their available time and budget. With mounting pressure to produce results and very little room left for detours, John knew he needed a new approach. That’s when he reached out to us. Not for help with the data they already had, but to find a new path forward before the window closed completely.
A Bigger Target Was Hiding In Plain Sight
When we came in, the pressure was clear. Much of the available time had already been spent. John and his team had initially focused only on the robotics and automotive sectors based on the patent’s origin.
We set aside the sectors they had already investigated and focused instead on what the patent actually described. A portion of the patent claim for US10XXXXXXB2 reads:
[Claim 8 of US10XXXXXXB2]
A system configured for imaging, comprising:
…generating an output image with an inner region of higher resolution and an outer region of lower resolution…
It felt familiar.
We saw a clear opportunity in smartphones, which have been utilizing dual-camera systems for years to create portrait mode effects, aligning perfectly with the patent’s claims. Here’s how it works:
Here’s how it replicates for the phones in simple terms:
- The phone uses two cameras simultaneously, each capturing the scene from a slightly different angle, much like how your eyes work together to perceive depth.
- One camera captures the entire scene, while the other focuses more narrowly on the center.
- The phone’s processor compares both views to determine what is in the foreground and what is in the background.
- Then it creates a final image where the center is sharp and detailed, and the edges are slightly blurred, mimicking how our eyes naturally focus.
Smartphones also offered several advantages: clearer documentation, teardown reports, and camera testing data. These resources were far more accessible compared to the robotics and automotive sectors. This gave us a practical and data-backed path to proving infringement.
We communicated this pivot to John, explaining how smartphones not only represented a larger market but also provided more technical details that could be leveraged for direct product testing. The decision to target smartphones was met with initial hesitation, but it quickly became clear that this was the most effective route to securing evidence and validating the claim.
The Problem with Public Data: You Can’t See What the Software’s Doing
Once we gained approval to proceed with smartphones, the next step was to collect the concrete evidence required to validate the infringement claim.
The Limitations of Teardown Reports
We initially explored several online resources to identify potential evidence, including teardown reports from platforms like iFixit and TechInsights. These reports break down the hardware components of smartphones, but they provide little to no insight into the image-processing logic that drives the dual-camera functionality. It was like reading the specs of a high-performance car engine, but still not knowing how the car actually drove. While we could see the physical components, there was no explanation of how the hardware interacted with the software.
Product Manuals Pose More Questions than Answers
Product manuals also proved unhelpful, as they didn’t explain the internal processes behind image capture and processing. They primarily described basic user functions, such as how to activate portrait mode or adjust focus, but they did not explain the underlying processes that made these features work. The complex image-processing logic that determined how the cameras created selective focus and depth simply wasn’t there.
We gained valuable insight into the basic functions of the camera system. Still, without understanding how the device’s internal processing worked, we had no way to connect the patent’s claims to the real-world behavior of the smartphone. The gap between what we knew and what we needed to prove the case seemed to grow wider with every document we reviewed.
Finding Leads in the Camera Reviews
As a last resort, we turned to camera reviews from popular tech reviewers. These analyses, while insightful, didn’t provide the granular detail we needed to connect the image behavior with the patent. Sure, some reviews mentioned how smartphones handled image sharpness and depth effects, but the information was often high-level or vague. It was like hearing about a great meal but never being told the recipe.
Tech reviewers, no matter how reputable, lacked the access or resources to delve into the inner workings of the software driving the cameras. The reviews suggest that the dual-camera system achieved a sharp center and a blurred background effect. Still, there was no definitive evidence tying these observations to the specific image-processing mechanisms described in the patent.
After discussing these limitations with John, we emphasized the need for direct product testing to capture how the imaging behavior aligned with the patent’s method. This insight helped us secure buy-in for the next phase: setting up a specialized testing lab.
Setting Up the Lab: The Need for Direct Product Testing.
To bridge this gap, we established an optics testing lab that simulates everyday usage while capturing minute technical details. The goal?
Replicate real-world conditions under a microscope and observe how the dual-camera system handles resolution across different image regions. We used custom test charts and precise field-of-view measurements to simulate real-world scenarios and capture the phone’s image-processing behavior. The lab was equipped with various test targets:
1. ISO Chart / Starburst Pattern (Focus & Resolution Targets)
- Purpose: To assess changes in image clarity from the center to the edges.
- Insight: Confirmed selective sharpness enhancement in central zones, indicating region-specific processing.
2. Grid-Based Charts (Field of View Assessment)
- Purpose: To compare the capture area of different lenses (e.g., wide vs. ultra-wide).
- Insight: Verified that each lens captures a distinct portion of the scene, supporting differentiated lens behavior.
3. Visual Acuity Charts (e.g., Eye Charts)
- Purpose: To evaluate the distribution of resolution and sharpness across the image.
- Insight: Revealed that image clarity is not uniform. A higher resolution is applied in certain regions, suggesting targeted enhancement.
4. Depth-Variant Objects (Labeled Boxes at Different Distances)
- Purpose: To test how the camera handles subjects at varying depths.
- Insight: Observed sharper rendering for nearer objects, implying depth-based image optimization.
Maximizing Accuracy in Claim Chart with Product Testing
Once the test rig was set up, the next step was to gather the data that would confirm whether the smartphones were indeed using differing fields of view (FoV) as described in the patent. Our approach involved using a grid chart to measure the extent to which each camera lens captured the scene, which would help us validate the behavior outlined in the patent.
Setting Up the Grid Chart and Measuring Distances
We started by placing a 4 cm x 4 cm grid chart on a wall. This size was chosen because it was detailed enough to capture slight differences between the camera lenses, while still being large enough to be visible in images taken with both wide-angle and telephoto (zoom) lenses.
The phone was positioned at a fixed distance of 29 cm from the chart. This distance had been carefully determined after several test iterations, ensuring that both the wide and zoom cameras could focus properly. At this distance, the wide-angle camera could capture the entire chart, while the zoom camera focused on only a portion of it, creating a clear contrast for comparison.

Source: GreyB’s Internal Product Testing
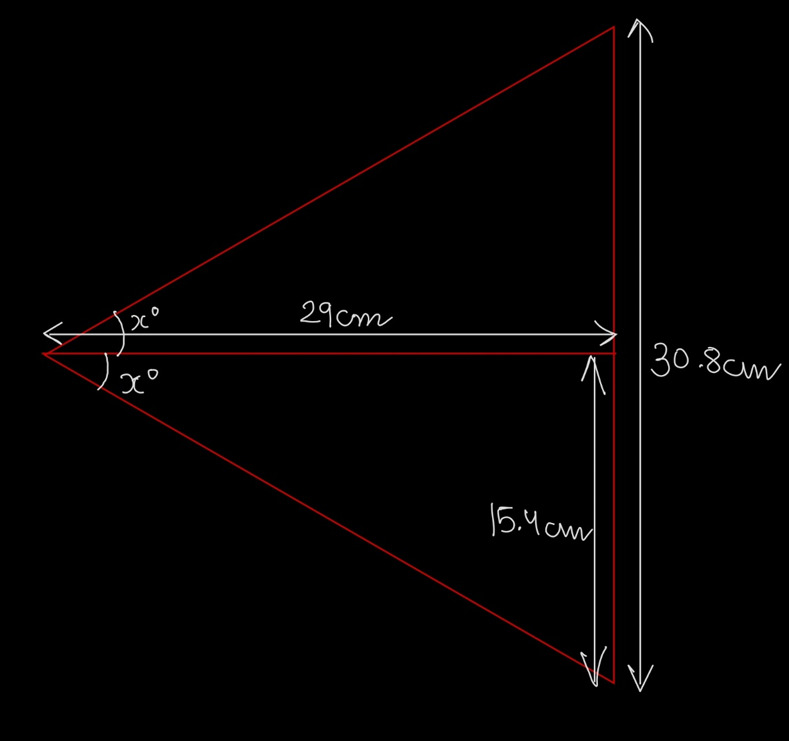
We used the phone’s camera app to capture horizontal and vertical views of the grid and measured the visible area in terms of the number of 4 cm squares visible across both the width and height of the image. These measurements gave us the actual scene coverage for each lens. We then used these values to calculate the diagonal field of view (FoV), the standard measurement for determining camera coverage.
- Calculating FOV (Field of View):
Horizontal FOV (hFOV)
hFOV=2*〖tan〗^(-1) x/d
hFOV=2*〖tan〗^(-1) 15.4/29
hFOV=55.8°
Source: Product Testing
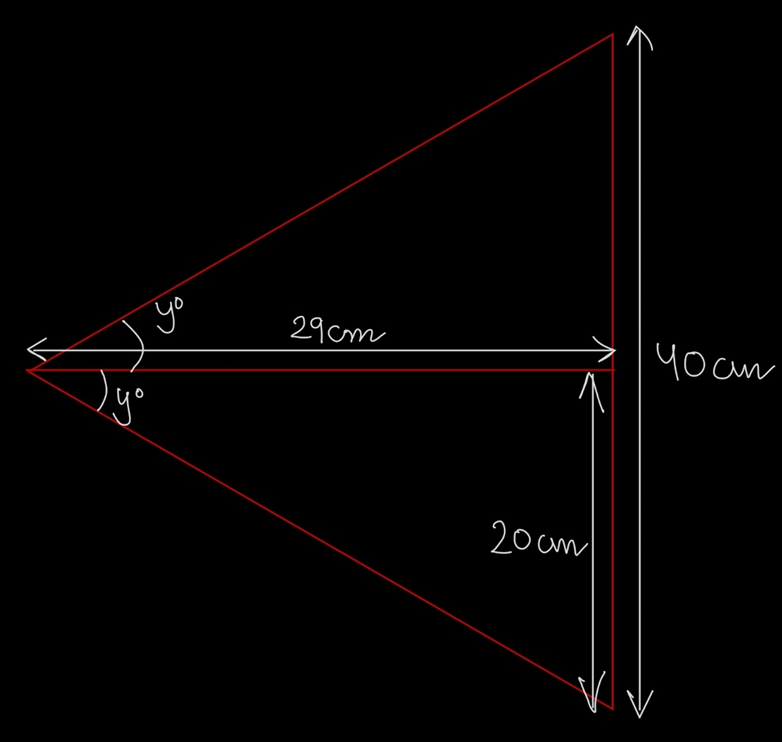
Vertical FOV:
vFOV=2*〖tan〗^(-1) y/d
vFOV=2*〖tan〗^(-1) 20/29
vFOV=69°
Source: Product Testing
- Diagonal FOV:
dFOV=2*〖tan〗^(-1) z/d
vFOV=2*〖tan〗^(-1) √(x^2+y^2 )/d
vFOV=2*〖tan〗^(-1) 25.23/20
dFOV=82.6°
Without this validated FoV data, it would have been difficult to assess whether one camera captures a wide scene and the other a zoomed-in section, a key element in proving infringement.
By using a test-based approach, we were able to measure how much of the scene each camera captured. For example, the wide camera captured an area of 30.8 cm horizontally and 40 cm vertically, while the zoom camera focused on a more specific, narrower part of the scene. These measurements helped us calculate the FoV for each camera, verifying that they indeed behaved as described in the patent.
The Final Claim Chart Update
With the new insights, we updated the claim charts to reflect accurate FoV data, adding the kind of clear, technical evidence John needed to strengthen his case and present a more persuasive argument in litigation.
| [Claim 8 of US10XXXXXXB2] | Updated Overlapping Information Using Relevant Snapshot from Product Testing |
| A system configured for imaging, comprising: | 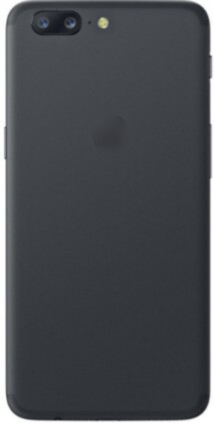 |
| a first camera having a first visual coverage zone | 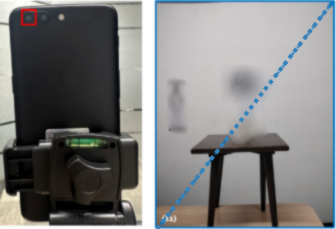 Image captured in Photo mode with a wide-angle camera and by covering the remaining camera |
| wherein the second image is derived from a subset of the scene within the first camera’s visual coverage | 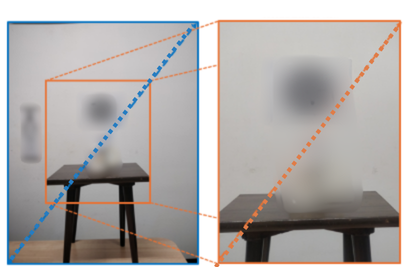 Above, the two photos illustrate the corresponding subset of the (2x) image (captured with a telephoto camera and covering other cameras) (right) overlaid on the 1x image (captured with the wide-angle camera and covering other cameras) (left) Above, the two photos illustrate the corresponding subset of the (2x) image (captured with a telephoto camera and covering other cameras) (right) overlaid on the 1x image (captured with the wide-angle camera and covering other cameras) (left) |
Conclusion
Patent cases are often won or lost based on subtle details that might be overlooked in initial claim chart preparation. While it’s common practice to cross-check claim elements, many critical aspects are often missed. This includes hidden technical features, jurisdictional requirements, or the functional equivalence of patent claims.
Eliminate these risks by conducting thorough final product testing and ensuring the claim chart is comprehensive and litigation-ready. This not only strengthens your position in court but also protects against the less obvious yet pressing challenges that could tip the scales in favor of the competition.
Talk to our research experts by filling out the form below.