Talk of budgets and the very first question that comes to the mind is — Given a certain amount of money, how much should be allocated to various expenses?
Should you abandon few patents from the portfolio this year? Should you invest in the technology landscape or use that money for filing more patents? Should you expand filing in other countries?
The answer to that question might not be very difficult to find for a person. However, for a company, determining how much to spend on different expenses is almost akin to a battle, at least half of it. The other half is to be able to effectively analyze spending to make educated decisions for upcoming budgets.
That said, analyzing the value gained from spending on research and patent protection (an integral and very important part of patent budgeting) is a very tedious task. This is precisely so as it’s very difficult to track the return on investment (ROI) at the end of the financial cycle.
Why so? Let’s look into the factors involved to understand this.
Why Patent Budget Monitoring is a Huge Pain in the Neck for Patent Review Boards?
Multiple cost variables are associated
The complexity of patent budgeting comes down to its many cost variables. There are often wide variances particularly in the number and frequency of prosecution or office actions and the time to grant. Other than this, the cost and time spent on R&D take a huge toll on the company’s profits.
Companies at the start of the patent process with just one or two patents, filed in a few countries, may find that they can put together a budget for their future patent costs with an acceptable degree of accuracy. However, sometime later, filing a small number of patents in multiple countries can rapidly become difficult to manage, and costs difficult to predict.
Budgeting requires Patent Review Boards to plan ahead of the time
Budgets are typically set on an annual basis. However, typical times to grant and prosecution actions occur over several years. Therefore, Review boards have to plan ahead of the time and have to consider many factors like expiration trend of their patent portfolio, future product and market trends, and time that would be spent on research and development.
For instance, the technology areas where the average life of patents is more than 7 years can put on lower priority in comparison to the patents that are expiring soon (i.e in 3 years). Therefore, such areas require an aggressive budget plan to score some valuable assets before losing the edge.
It is difficult to recall previous budgeting strategies if the knowledge is not institutionalized
Building a patent portfolio is not a short term process. Several people from various teams are involved in building and implementing strategies to mold the portfolio in its current form. And when the stakeholders leave, they take away a lot of knowledge with them. It becomes difficult to recall previous budgeting strategies if this knowledge is not institutionalized in a centralized platform.
Without the knowledge of the value gained or lost, stakeholders in the company won’t be able to distribute funds effectively for the coming cycle. Assessing which areas require more funds and which areas should it be cut short from, is a very difficult question to answer in such a situation. Therefore, there should be a method to institutionalise department knowledge.
Well, how do stakeholders in leading companies distribute funds to their research and patent department then? – You ask.
We have just the solution. Read on to find out.
How Patent Review boards can strengthen their IP budgeting strategies?
In order to determine whether or not the company’s expenditure is in accord with the planned expenditure, it is important to determine budget variances i.e. the difference between expected (allocated) spending and the net outcome. Now, in order to get this difference right in patent budgeting, stakeholders require clear visibility over the outcome.
What does clear visibility over the outcome mean?– You ask.
I’m talking of dynamic charts providing an elaborative view of fund distribution across various technology areas in a patent portfolio. The ability to drill down deeper to investigate trends and identify where they missed the mark.
All in all, you, the members of review boards, need the power to see how your company’s portfolio is evolving over the years, which technology areas are going strong, and where the company needs to invest more. Picture a dynamic view having all this information right below your fingertips.
Here’s an example of what such a view might look like:
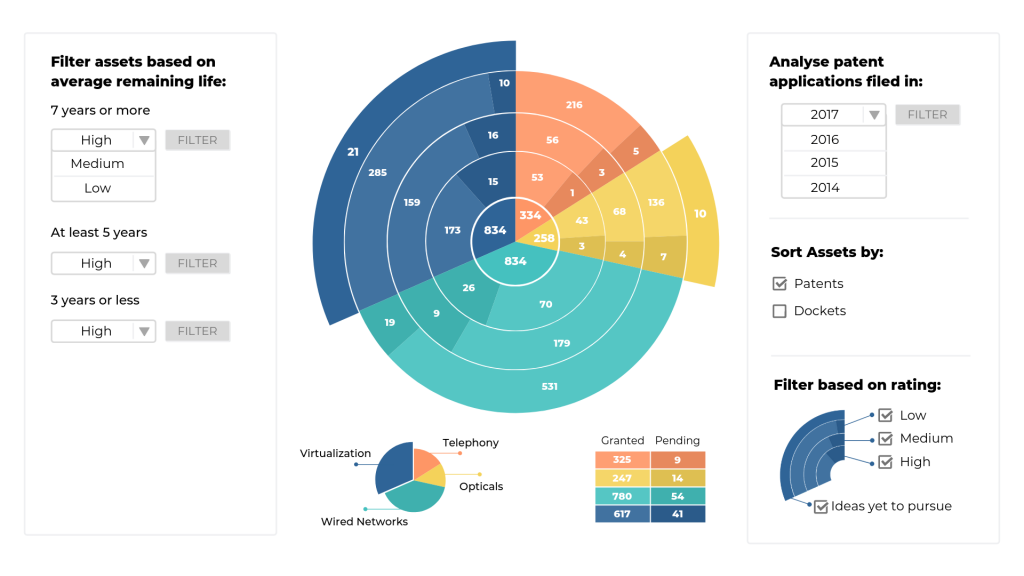
The above screenshot not only represents an elaborative view of your patent portfolio, but it can also help you determine exactly which areas you need to invest more, and which areas can take a budget cut.
Interested to know how?
For that, I must first explain the details lurking in the above image.
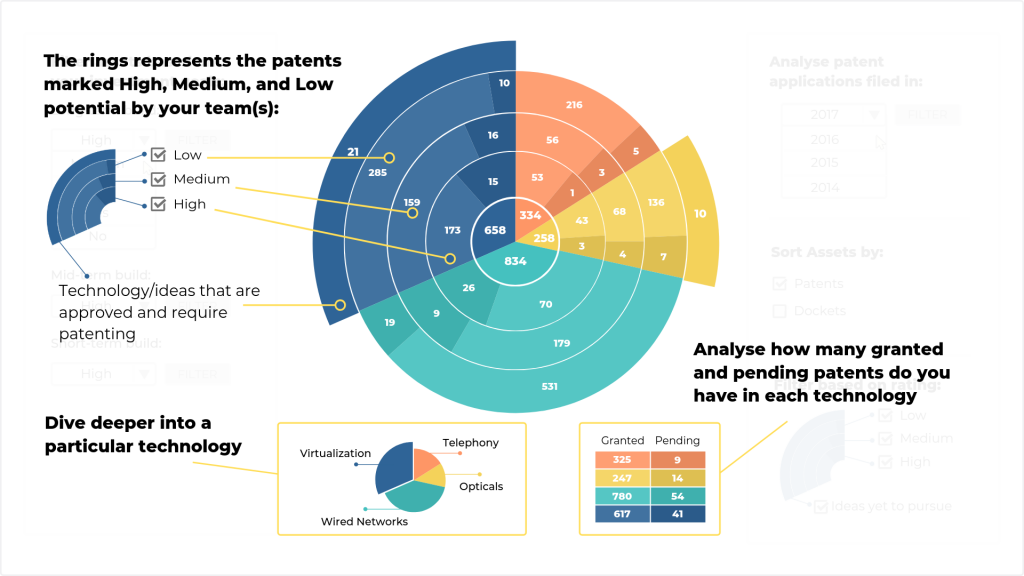
Right in the center is the area showcasing how many patents or patent families you have in each technology. This view visualizes how these technologies compare with each other and the lighter and darker shades of colors show how many granted and pending patents you have in them respectively.
This is the clear visibility that can help stakeholders better gauge the return on their investments. For example, filters on the right part of the dashboard allow you to have a closer look at your portfolio’s growth.
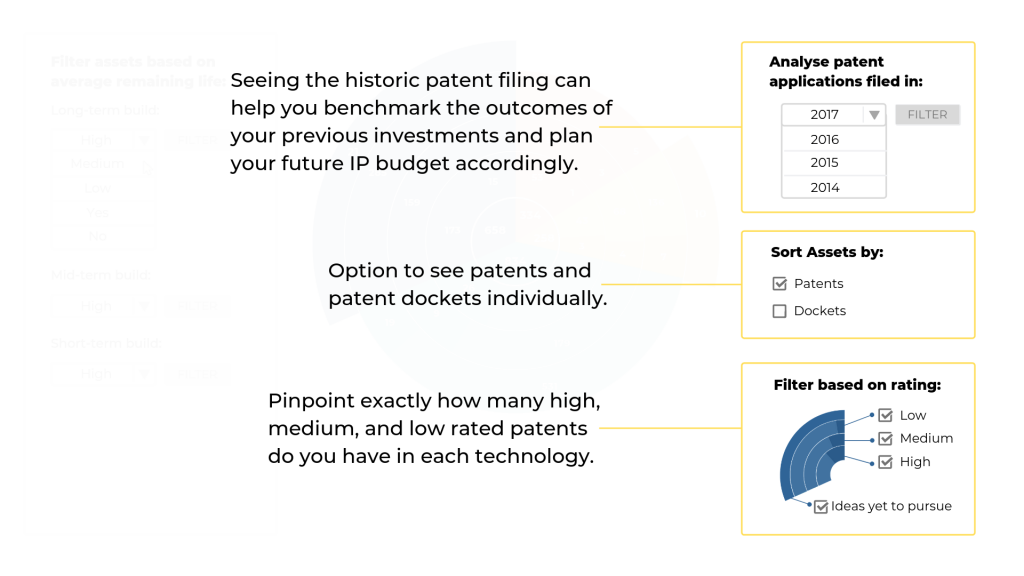
These filters can help answer questions like:
- Which technology areas were in prime focus in the previous financial cycle?
- Which are the high valued patents that protect your core technology areas and shield your products?
- From which patents you can cut short the budget to spend it on areas with high ROI? – Pruning low valued patents.
Similarly, filters on the left-hand side of the dashboard can help you focus on the areas aligning with your organization’s market and business goals. One of the biggest factors that get accounted for when allocating the budget is a company’s long and short term market goals.
If your company is working on new products and technologies, it makes sense to invest more in those areas. If organizations have a stronghold on a particular technology in the market, it becomes important for them to maintain that edge by focusing more on those particular areas over the years.
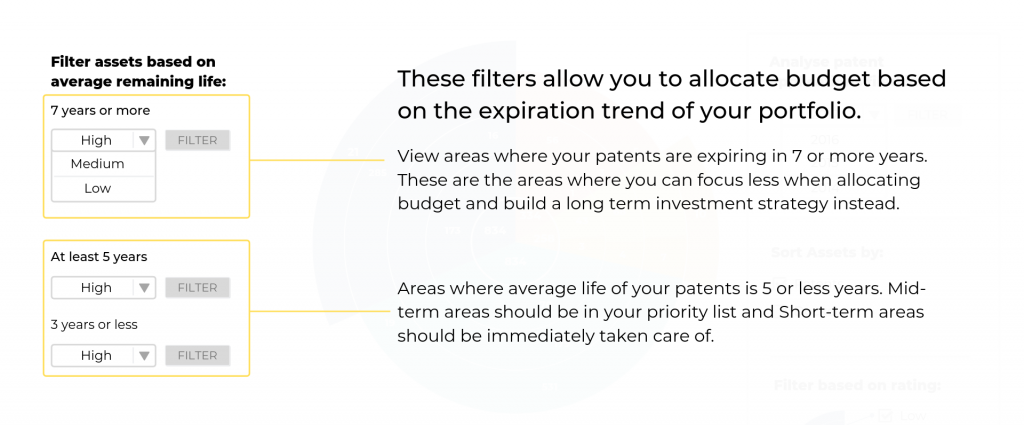 Another factor that gets accounted for is the expiration trend of your patent portfolio. Similar to how a patent takes a couple of years to get granted and companies need to plan their budget allocation accordingly, patent expiration is another thing they need to prepare for beforehand.
Technology areas where a lot of patents are expiring in the next 5 years should be on the priority list as these areas are critical to the company’s growth and market position. It becomes even more critical when a lot of these expiring patents are highly valued and are crucial for your business.
The dashboard view that I’ve showcased above is built by keeping this very thought process in mind. Its dynamic charts and filters make it a perfect tool to help you disperse your IP budget and monitor the outcomes.
Stakeholders need better clarity and control over the growth of their portfolio. By knowing where they are falling short or exceeding the mark with the budget, managers can do a better job in evaluating the company’s performance. This information can then be used to distribute funds more efficiently based on priority and need. This can enable patent review boards to spend sufficient money in a different area of interest than originally planned, although the budget will still act as a guideline.
Authored by: Gaurav Sharma, Research Analyst, Solution Team, Vikas Jha, AVP, Solution, and Shabaz Khan, Senior Marketing Analyst.