With the overall change in the patent market- dropping sales, increase in software patent sales, rise and fall of NPE litigation and the mere existence of Alice, it is important to encompass the various aspects of the market, and ask pertinent questions about the same.
Questions like, which companies have been the top patent investors? What technologies and products are hot in the patent market? How has the market changed over the years? And what does the future hold for the investors and sellers in the patent world?
So we went rummaging through the 2019 Patent Market reports to find insights that help us answer these questions. And in our pursuit, we came across an exhaustive report by Richard Oliver Insights. For the uninitiated, Richardson Oliver Insights is a leading provider of secondary patent market data (most trusted as well).
This report covers broader market aspects, some of which we have summarized for your quick reference below. You can find the complete report here.
- Patent sales have decreased to $300 million from $353 million in 2018 – as buyers and sellers transaction is shifting to more private deals.
- Asking prices have recoiled 56% from 2018’s daunting drop of 30%, although much of this shift can be attributed to price fluctuations in single asset deals.
- Software sales have continued to flourish, accounting for 52% of sales.
- Old deals were still sold even though they had been on the market for more than three years.
- Of the sold brokered deals, NPEs are seen to be buying a larger share – Though NPE litigation is down overall, litigation threats from sold packages have continued to rise.
All in all, the asking prices are kicking up from 2018, exceeding even the 2017 numbers. However, the market size is down, and for those on the inside of corporations, it looks as if assertion activity from NPEs might be just around the corner.
The following article is an executive summary of the report.
Since, it is essential to cover every aspect that contributes to the overall market report, let’s discuss each of them in brief.
Market size
If you add up the asking prices of all the assets tracked in ROI’s database, you get about $25 billion of patent assets for sale. Of which sales of $6.2 billion were identified on rendering the assignment records for these assets. This is almost $1 billion more than their tracked sales in November’18. The report suggests that the brokered market may have dwindled, but the secondary patent market is still rewarding.
Projecting through 2020, the market is expected to rise another three Billion dollars to nine Billion for the next year (a pinch of salt!). The report also shows an extrapolation of the market through the third quarter of 2020.
Patent brokers
Accounting for 4.5% of the packages on the brokered market (down from 5.9%). ROI believes that fixed-fee auctions such as Allied Security Trust (AST)’s IP3 programme are gaining popularity among individual inventors who prefer not to use a broker.
Overall, 14 of the 16 brokers mentioned in the report were also in the previous year’s list. Thus, the top brokers seem to have locked down their operations as well as their market share.
The report also suggests that all the brokers are experiencing higher closing rates when packages have more time to sell. We’ll discuss more on the selling period in the latter part of this article.
Packages
According to the report, software continues to be the largest technology grouping. There has also been significant growth in certain software technologies, including increased listings relating to the Internet of Things, internet-scale data management, AI, machine learning and content, and consumer software such as video and image processing.
On cross-checking this with our projects in the past year we came across the fact that 45% of the cases where our team created success were from the software industry.
-Vincy, Patent Infringement, GreyB
Author’s Note: To have a look at the technology and patent filing trends in AI, Machine Learning, IoT, etc., read our joint survey on upcoming technologies with Kilpatrick Townsend and Stockton, US.
Due to the continued popularity of listings relating to the automotive and energy sectors and the steady rise in medical device listings, the “other” category has held its position over hardware.
Fig. Package distribution by the technology group
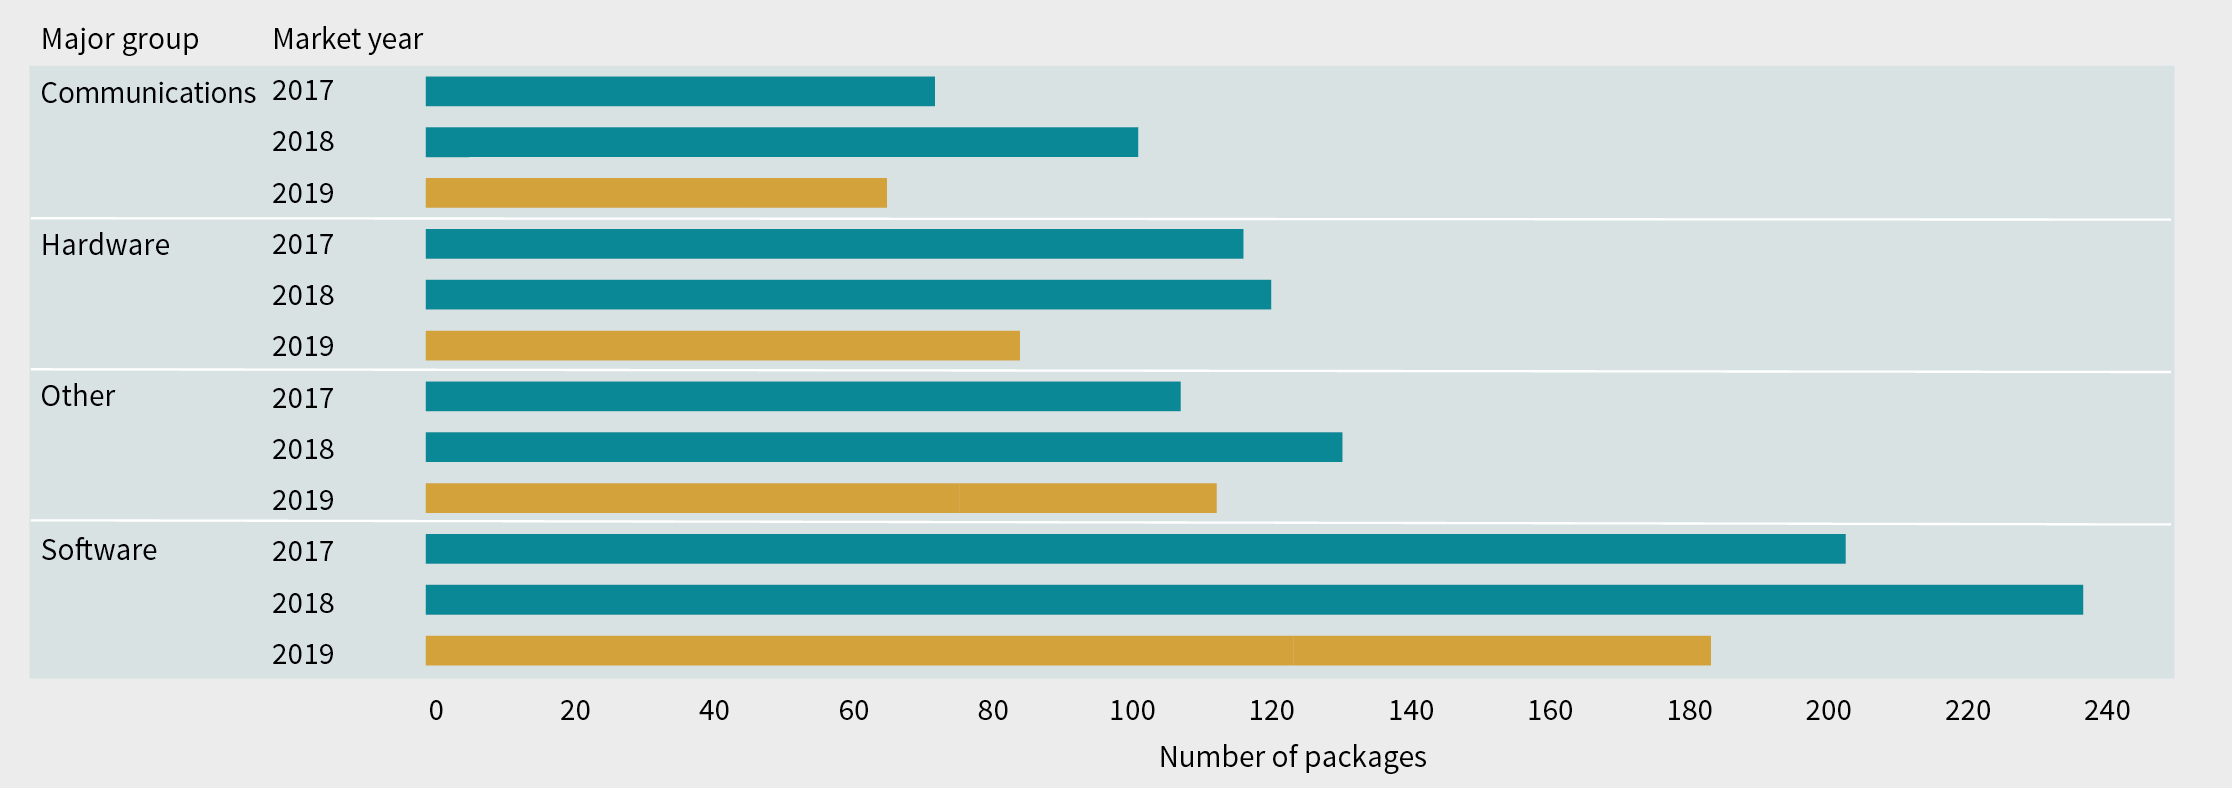
Source: ROI Brokered Patent Market
Narrowing down to the companies, the biggest technology companies (eg, Microsoft, Apple, and Google) remain the favorite targets of patent sellers’ EOUs. For the third year in a row ROI has noted an increase in references to Facebook, which is now as prevalent in EOUs as others.
Pricing
The data suggests that the latest asking prices are closer to those in the 2015 and 2016 market years. As a seller, you may be ready to clink a glass with relish. This market has been as unexpected as ever. As for prices, the 2018 price drop appears to have been an anomaly with 2019 prices rising across the board.
Prices are significantly affected by package size, EOUs, the year in which a package has been listed, and the technology area. And evidently, these variables are not independent.
To figure out the prices considering this interdependency, a system can be created to calculate technical, legal, and commercial scores for a patent.
-Aadarsh, Patent Infringement, GreyB
When it comes to top asking prices, the report reflects that the “other” category has taken over as the highest priced category. This is due to the strength of automotive, energy, and imaging prices in that category.
Fig. Average asking price per asset by the technology group
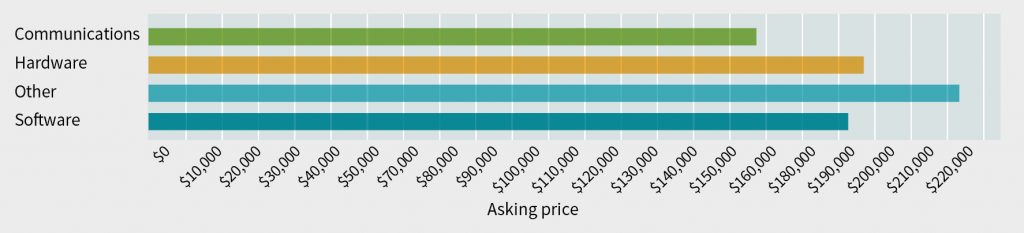
Source: ROI Brokered Patent Market
Notably, communication packages are also starting to catch up with the rest of the pack.
Impact of EOUs
EOUs have been a great way for the seller to show that their package deserves a higher price than average. Over the full dataset, ROI observed a 27% price premium for packages with a seller-supplied EOU over those with no EOU provided. In fact, the expected value of a package with an EOU is 64% greater. In the next part of this article, you’ll see that the sales rates are higher for deals with EOUs so the value of writing an EOU is compounded.
Sales
According to the report, buyers are still generally focusing on assets in smaller packages. Single asset packages and packages in the two to five asset range continue to sell better at a rate of 12%. Therefore, we can conclude that smaller packages outperform their larger counterparts.
Single Asset packages make only 25% of the patent market in 2019. Most companies prefer bundling their assets and then going to market. Though it’s a clear indication that clusters are easy to sell, at the same time, we can suggest to our clients that it’s difficult but not impossible to sell a single asset. It has its perks – you get to quote more price (56% more this year).
– Muzammil, Patent Infringement, GreyB
We know that moving quickly can be an advantage in buying a patent. But the corporate decisions include a lot of sign-offs, so is the market moving quickly?
Well, the report suggests that 80% of the sales from 2018 listings occurred within 10 months from the receipt date of the package (up from between six and seven months for the 2017 listings). This depicts that the patent market is slowing down in closing a deal.
Despite this, accelerated decision making is still beneficial. Timeframes act as a guideline, but there is no substitute for an efficient deal pipeline. If you are trying to limit NPE risk and the NPE buy a package before you review it, it is simply gone.
As far as packages with EOUs are concerned, packages listed in the 2018 calendar year with EOUs were 29% more likely to sell than packages without.
Life after Alice
The report reflects that packages from technology categories affected by the Supreme Court decision and listed in 2016 are 53% more likely to sell than packages in the overall market. It seems that the broader fear of Alice has subsided. Buyers and sellers have figured out a different perspective to look at patents in Alice affected technologies.
Fig. The percentage difference between Alice-affected sales rate and total market sales rate
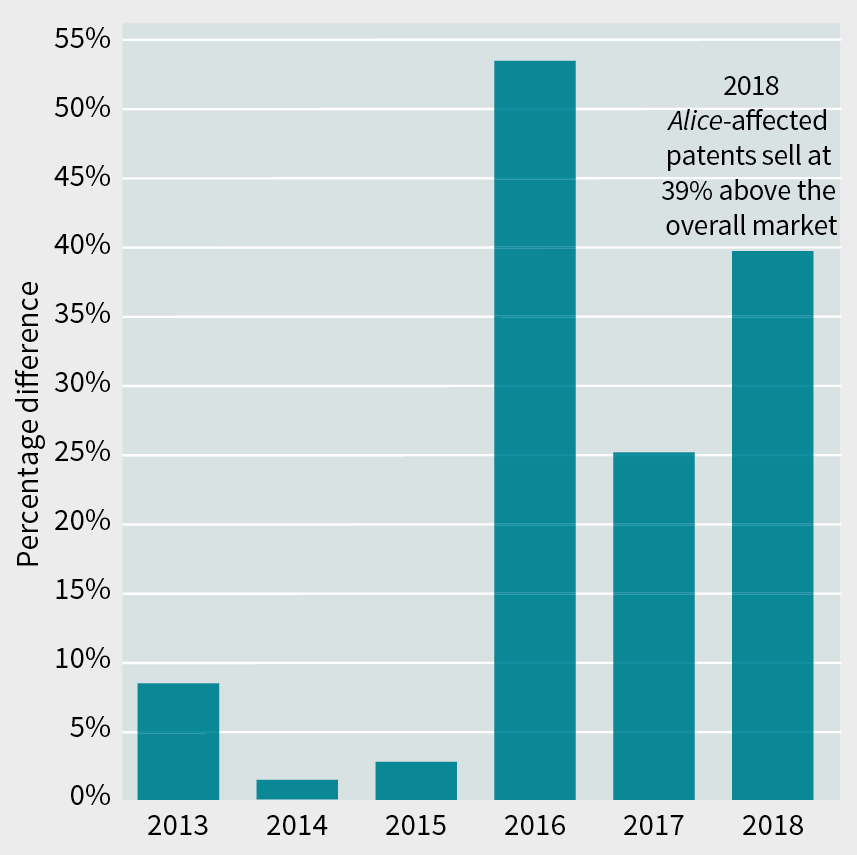
Source: ROI Brokered Patent Market
Sellers
According to the Report, operating companies continue to be the primary source of transactions – unsurprisingly, considering that those companies file the majority of patents – and were the sellers in 63% of transactions.
Generally operating companies track sellers to mitigate risks of these patents.
Companies like HP, Intel, AT&T, Huawei continue to be top sellers, once again. Companies are mining the portfolios and finding which ones can be sold.
– Vincy, Patent Infringement, GreyB
ROI suggests that to mitigate the risk of these patents without purchasing them companies can take an early license to a seller’s portfolio. This may be significantly less expensive than taking a license after the assets have been sold.
As a seller, you must find answers to questions like- “Did the average price per asset change?” A finer question would be: “Considering my technology area, what size package should I bring to market to maximize the price per asset and sales rate?”
A deeper strategic analysis can help you find the answers.

Buyers
It can be derived from the report that the percentage of packages purchased by NPEs has increased every year since 2016. This reflects that we may be on the zenith of a new wave of NPE activity.
Operating companies should revisit their risk models with a focus on smaller litigations from multiple entities in addition to larger NPEs.
The report not only suggests an increase in NPE buying but also sees an increase in litigation activity. The brokered patent market represents a large pool of litigation risk.
When looking at the sold packages that were litigated after their listing date it was found that 1,752 litigations have been filed. Of these, 90% were litigated by an NPE and the average number of NPE-filed litigations for these packages was 11.5.
This number is depicted considering only filed cases, and does not include private assertions and licensing deals that were settled before the litigation was filed.
Note that the market price is simply the price that the market will bear. But how does the seller know it’s a good deal?
To sell assets at a good deal, you must:
- define the current value of those assets in the context of your specific situation; and
- understand what the market price is at the time of a transaction.
Similarly, if you are on the buying end, how do you know that you got a good deal?
ROI suggests that while their data can help you identify what the market price is, only deeper strategic analysis can tell if you got a good deal by determining what its value is to you.
Buying a patent that turns out to be of no litigation potential will harm your portfolio even if bought at a price less than on the market.
Want to buy patents in your domain that have high litigation potential?
We’ve got you covered! Just fill the form below and our team will get in touch to discuss the specifics. <Attach form>
Full Market Size
From the report, It appears that the increase in market size in 2018 did not hold for 2019. ROI estimates the 2019 market size to be $300 million, down from last year’s estimated $353 million. They suggest that while this drop is significant, the market has remained larger than their predictions for 2015, 2016, and 2017 ($233 million, $165 million and $296 million, respectively).
Opportunities, conclusions, and reflections
From the report we can conclude that the secondary patent market is ever-changing. However, there is always an elbow room for buyers to make good deals that support their business requirements and for sellers to successfully monetize their assets.
In 2018 the market skyrocketed in size but asking prices dropped by 30%. This year, prices surged by 56%, but the market plunged in size.
New buying methods and private deals are becoming increasingly common for the past four years. NPEs have been buying a larger share of packages.
EOUs continue to garner a premium. Sold packages are litigated at higher rates and Alice-affected technologies are selling better than the rest.
How can GreyB help?
While dealing with patent transactions what is it that bothers you the most —
- Is it how to identify patents to acquire early? Or
- Which patents can be ‘gems’ in your portfolio? Or
- How valuable are these assets compared to others in the technology area?
GreyB can offer the expertise that helps you find all the answers regarding the value of your patent(s).
Over the years our team has acquired technical and manual skills to deliver the best service to our clients. These include
- Filtering patent assets and identifying gold ones to sell; (To quickly identify patents worth reviewing for sale potential. We developed some in-house tools and algorithms)
- Curating a list of viable sellers and buyers;
- Skimming through patents and identifying those that are important, with a focus on their claims as well, this is vital as it allows buyers to focus on the most important parts of a package first (Sometimes identifying good patents and keeping those rather than abandoning is the key task, read more);
- Guiding sellers concerning sales terms and timelines;
- Defining the process for diligence, bidding, and sales; and
- Developing evidence of use (EOU) materials. (Read our documented thoughts on what makes good EOU’s here and here)
Want to sell your patents or looking to buy more?
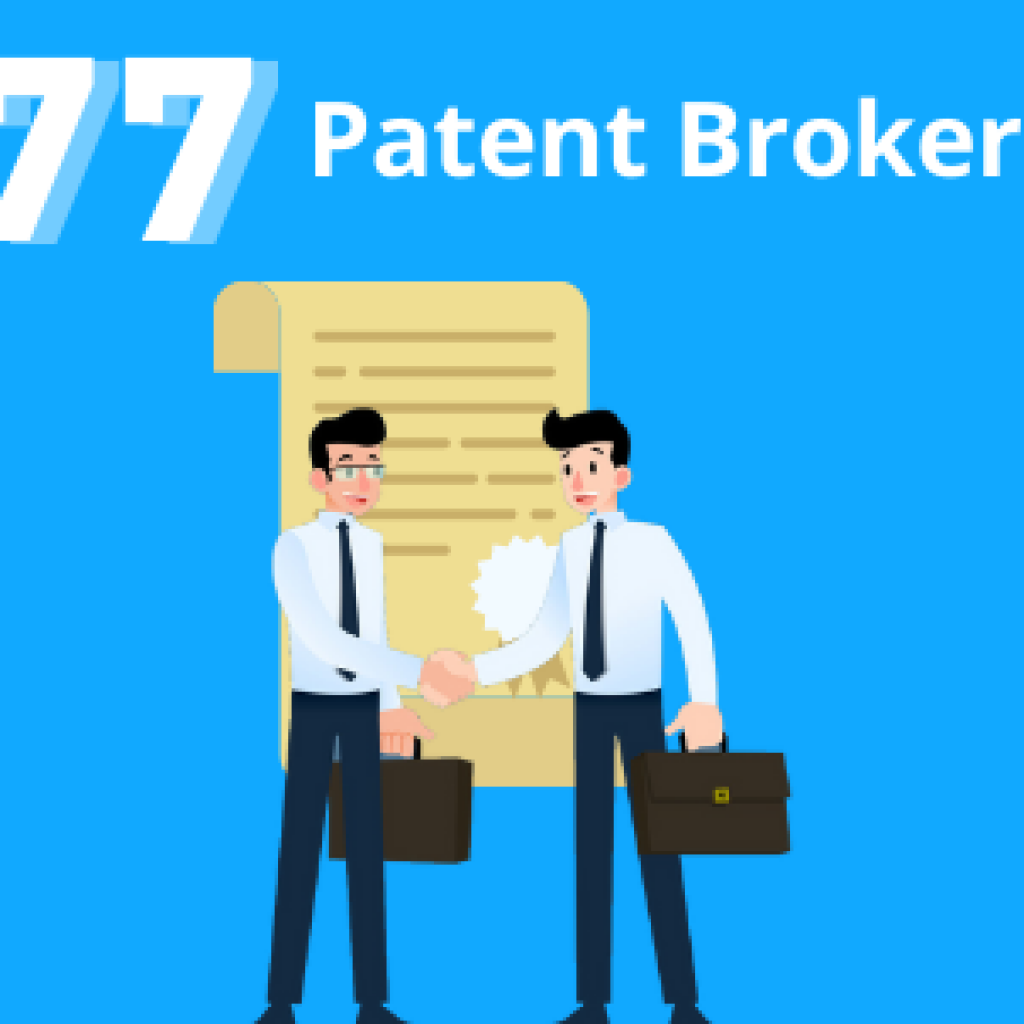
Here’s a list of 77 patent brokers from different countries that can help you evaluate, and sell or buy patent assets. But before you go about it, make sure you know the value of the patents you hold or plan to acquire.
Authored by: Nidhi, Research Analyst, Market Research