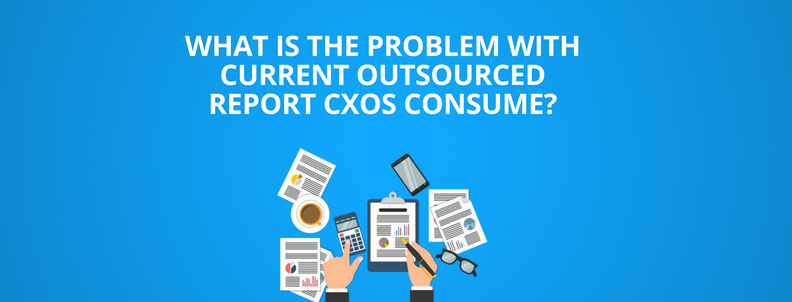
In the last article, What Is The Problem With Current Outsourced Report CXOs Consume?, I discussed the problem with the current outsourcing practices that CXOs follow. They receive customized analysis which paints a part of the big picture they want to see. Result: they get answers to a particular set of questions while a big lot remains unanswered.
At GreyB, we work with a lot of C level executives. We receive a number of similar requests where CXOs ask us to do such an analysis. However, we don’t deliver reports that only answer a particular set of question leaving all the others unanswered. Instead, we deliver reports that provoke them to ask more questions, a lot of which they didn’t think of asking earlier.
Two roads diverged in a wood, and we took the one less traveled by, and that has made all the difference.
Since we had an idea about their problem with the outside analysis, we did not want to repeat the same process. And, in our pursuit to solve it, we formulated multiple strategies after having discussions with our clients on how they consume such reports and what problems they face. We also had post strategy formulation discussion to understand their take.
To be at par with their expectations, we incorporated many of their useful pieces of advice and inputs to find the best way out. After trying various options and understanding their pros and cons, we found our niche.
We developed a business intelligence (BI) platform where the information extracted could be displayed graphically in dynamic dashboards. We are using dynamic dashboard for answering a particular question(s). There could be any number of such questions and a corresponding insight for each one of them. These insights may further lead to more questions.
To get answers to those questions, more dashboards could be prepared and integrated together to form a storyline. In order to make the information even more useful and insightful, the questions are prepared in collaboration with the client to target the particular areas of interest.
Below are some of the various insights that you can drive from the dynamic representation of information we provide:
- Which big players are trying to enter into your domain?
- Which are the emerging competitors that could be a big threat three to five year down the lane?
- What strategies your competitors are following?
- What are their areas of interest?
- What is the growth rate of a technology area of your choice?
- Where are the white spaces in your technological area of interest that you can exploit?
- Which are the potential companies that you can partner with, merge, acquire, etc?
Being an interactive platform, these insights could be driven out with just a few clicks.
Additionally, we can add more dashboards targeting the follow-on question. This not only saves clients time and resources but also helps in efficient decision making. This happens because they get all the information in one place.
Further, the need to collaborate with members from different teams gets obviated. Since strategic decision making is an evolving process; we maintain and keep these dashboards up to date depending on a specific request of a client.
Let’s Have a Look at one Dynamic Dashboard in Action
Let me give you an example where a client can explore different possibilities using dynamic dashboards of our BI Tool.
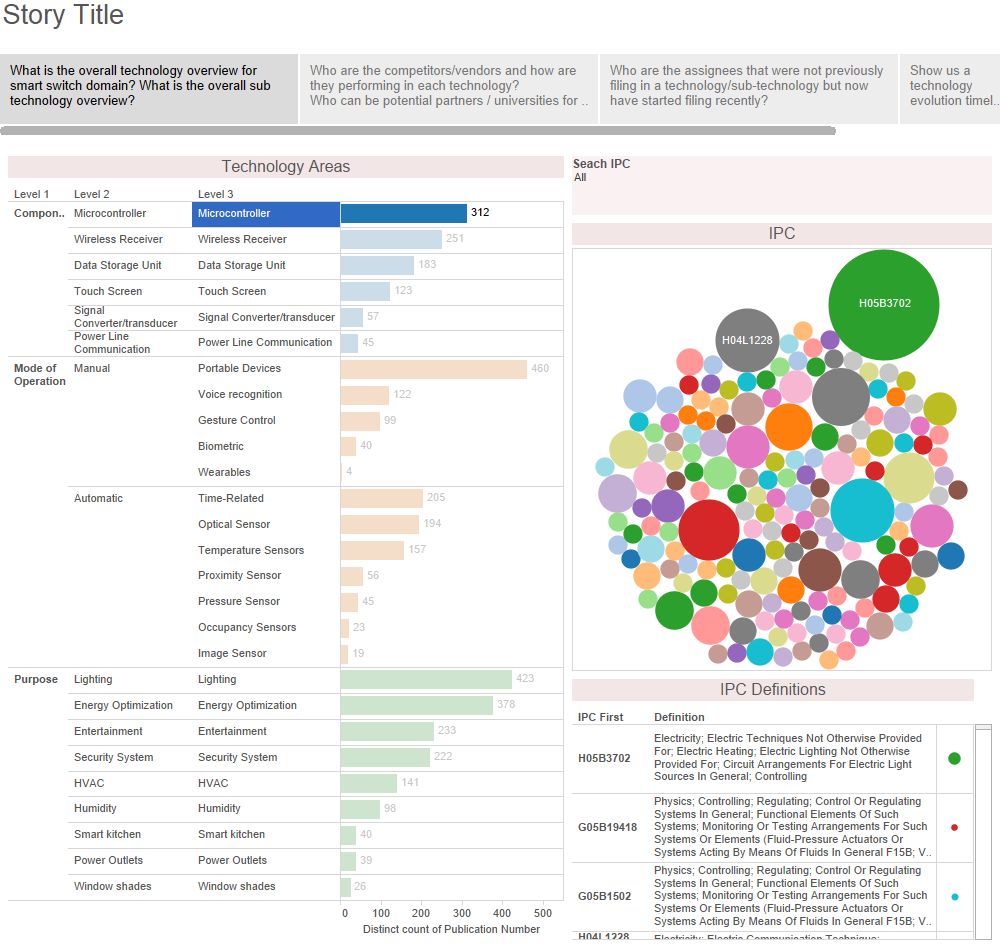
In the storyline, you will see, What is the overall technology overview in the domain?, and What is the overall sub technology overview? as the first set of questions. Thereafter, most of the clients asked what their competitors are up to a corresponding tech, and sub-tech domain. A second dashboard answers these questions. Corresponding to the insights of the second dashboard, further questions come up and further dashboards get built.
The dashboard we are discussing is framed around the second question about competitors. It answers questions like:
- Who are the competitors in a corresponding tech area?
- How is each competitor performing?
- With whom collaborate –university/corporates—to mitigate risk from the competition?
The two graphs in the dashboard are interlinked with each other. Selecting an item from the first graph will bring distinctive changes in the second i.e. second graph will show the figures corresponding to the selection in the first graph.
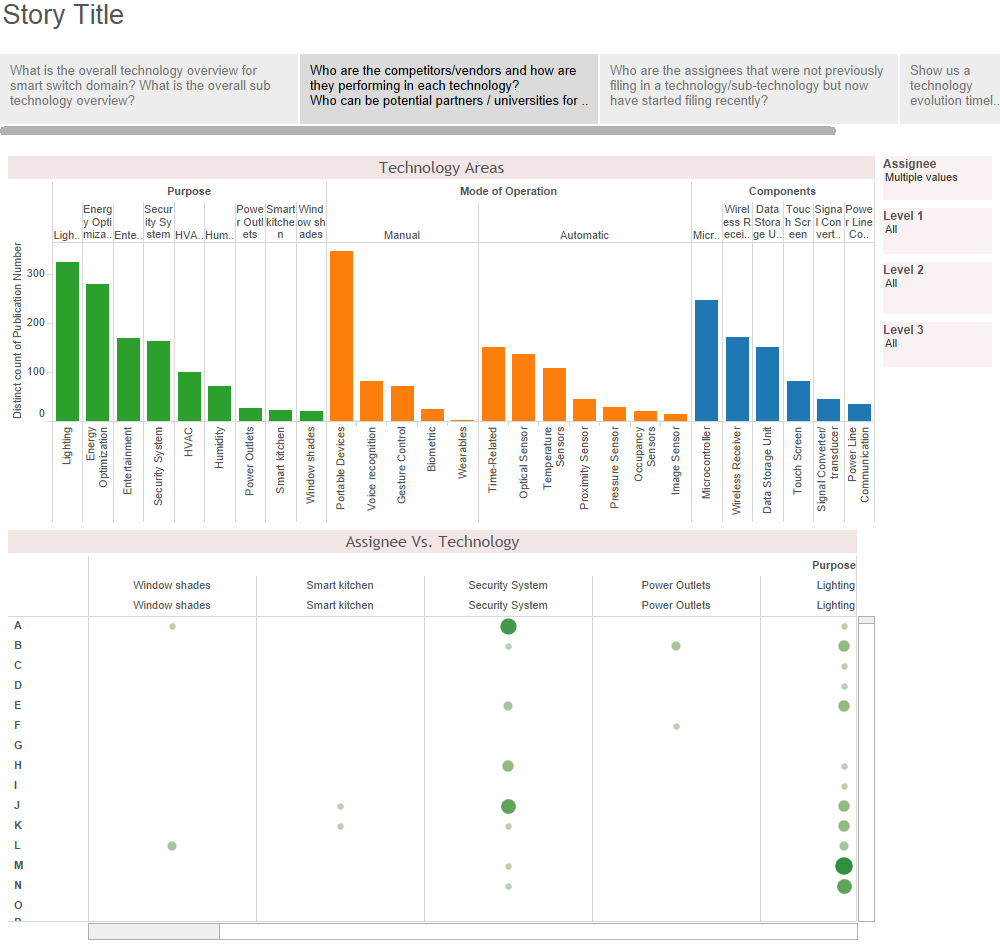
In the first graph (bar graph) above, for example, selecting a particular technology area of interest will bring the corresponding changes in the second graph. It will then show the competitor activity in that technology area. This way you can analyze the state of technology in the domain in question.
Moreover, you can also compare activities of different competitors head-on to see which competitor is how big a threat in which technology area? For the purpose of understanding it even better, let me take an example from the dashboard above. As we can see that company ‘C’ is very active in the ‘Microcontroller’ technology area whereas in ‘Portable Devices’ it is still a rookie.
Now, let’s say that your company is strong in ‘Portable Devices’ which isn’t explored by company ‘C’. On the other hand, ‘C’ is strong in ‘Microcontroller’ where your company has a weaker portfolio. This is an opportunity for collaboration as it makes both companies better at a weaker tech area.
This way you can decide companies for collaboration (merger and acquisition) without having to beat your head through multiple pages of unstructured information.
You can also find technological white spaces and plan your next move. You can keep a check on the new and emerging companies in the domain. Also, you can keep a close eye on the companies which could pose a potential threat to your business.
This could be very handy information while analyzing the competitors and their strategic next step. You can explore more about your potential competitors and their core areas of interest by analyzing their (recent or past) activity in the respective technology areas.
Evidently, these insights are vital to understanding the different aspects like trends, evolution, market potential etc. and helps in carving strategies for business sustainability and growth.
Conclusion
The ultimate aim here is to provide a tailor-made analysis to the CXOs that doesn’t only answer a particular set of questions but also inspire them to ask more and provide answers of their subsequent questions as well. Further, our aim is to save time and money of CXOs while they make strategic decisions.

Authored By: Gaurav Sharma, Associate, IP Solution