Why IP Benchmarking is Important?
In recent years, technology has witnessed a significant rise in patent filing activities. This has presented some problems and posed critical questions in front of management. Some of them being:
- Are we spending more money on patents as compared to our competitors?
- What is our ROI on patents?
- Are we filing patents in the right direction i.e. in-sync with our business vision?
- Are we protecting our core products?
These and many other questions have paved the path for development of a new performance metric, known as IP benchmarking.
Like traditional benchmarking – a process where a company assesses and evaluate its position in the market compared to its competitors – IP benchmarking is used to assess and evaluate an organization’s position by comparing their intangible assets with those of competitors.
Though the process of benchmarking has been around 1970s, IP benchmarking is still untapped and is not widely used by corporations. This is, in fact, unfortunate as this process has the potential to help gauge a company’s IP performance.
It’s never too late to start though. Below we have listed the metrics analyzed as a part of the IP Benchmarking process and what each of these metrics measures along with examples.
The Performance Metrics of IP Benchmarking
Some of the metrics that are usually analyzed during the process of IP benchmarking are:
- Yearly Patent to R&D investment
- Number of Patents filed vs. the licensing revenue
- Research collaboration with universities
- Age and Size of the company
Before these metrics are analyzed, it is important to get one thing right:
Selection of the Competitor
Selection of the right competitor is paramount when one evaluates their own performance. It is vital because:
- It helps get the stats right and
- It helps to evaluate the right ratio of the R&D investment to the number of patents filed.
As an example, it wouldn’t be wise for the heads of Apple Inc. to compare its patent to R&D Investment (PRDI) ratio with that of a startup which files more patents for a lesser investment and to build a large patent portfolio to attract investors.
However, if the objective is to evaluate their business strategy, comparing the Patent to R&D Investment (PRDI) ratio of emerging companies (startups) could be useful. This can help in figuring out research labs and small research companies researching on technologies of interest and help make the acquisition decision.
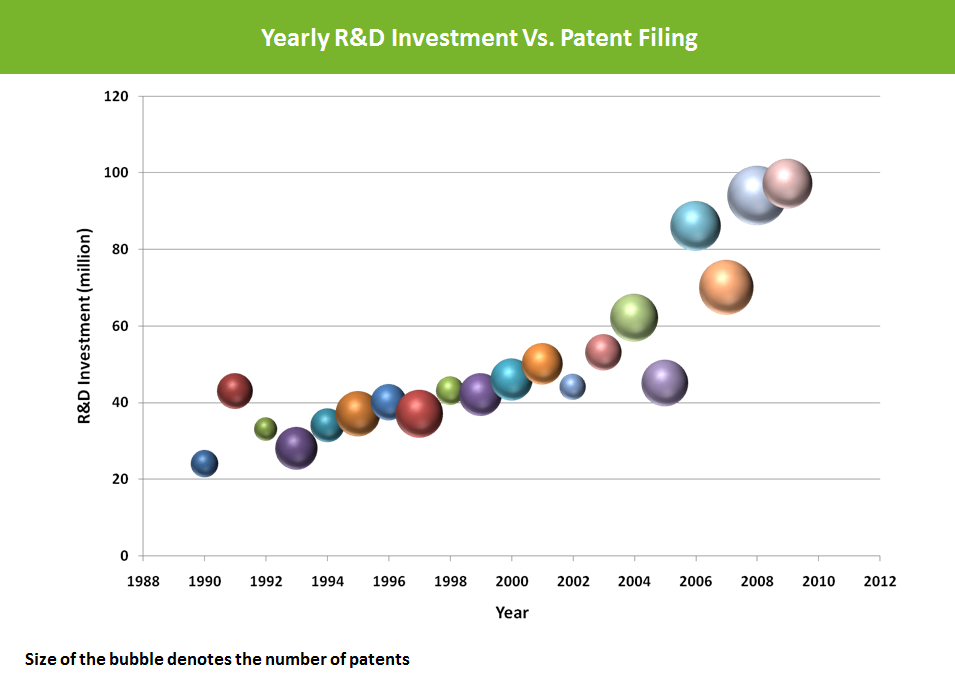
How Yearly Patent to R&D Investment (PRDI) is calculated?
The Yearly Patent to R&D Investment (PRDI) ratio is calculated based on how the company has invested in its R&D over a period of time and how that investment has converted into intellectual property. The PRDI ratio of a company or a close competitor may look like this:
Every company has their own way of doing business and you can’t deduce too many insights just by looking at their investment and corresponding patent filing. Therefore, the best way to look at the PRDI ratio is by simultaneously looking at multiple companies. The weighted average ratio of companies can be taken for this comparison.
Let’s say a company has various competitors. Among them, some may have higher PRDI ratio while others may have a lower one. Some of its competitors are large sized organizations while some are startups. Hence, that company can’t compare itself directly with any one of the competitors. So, it would be best for them to individually calculate patent to investment ratio of each competitor and then take an average of all. This will give them a broader idea of the industry, such as how much the industry is investing in R&D for generating intellectual property.
For instance, the graph for AT&T vs. Top 20 of its competitors is depicted in the chart below:
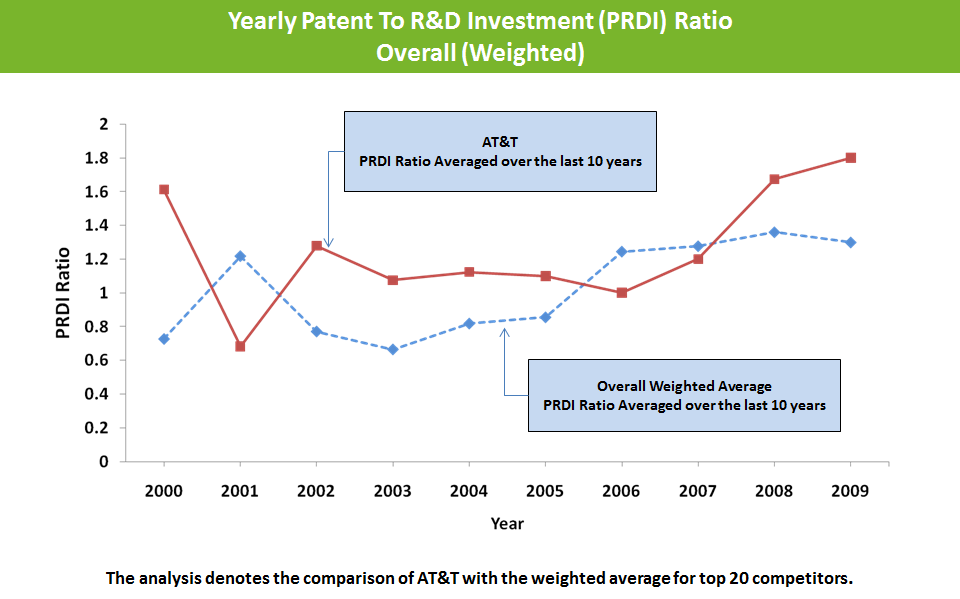
This clearly shows how AT&T investment strategy has turned out to be better than all its competitors.
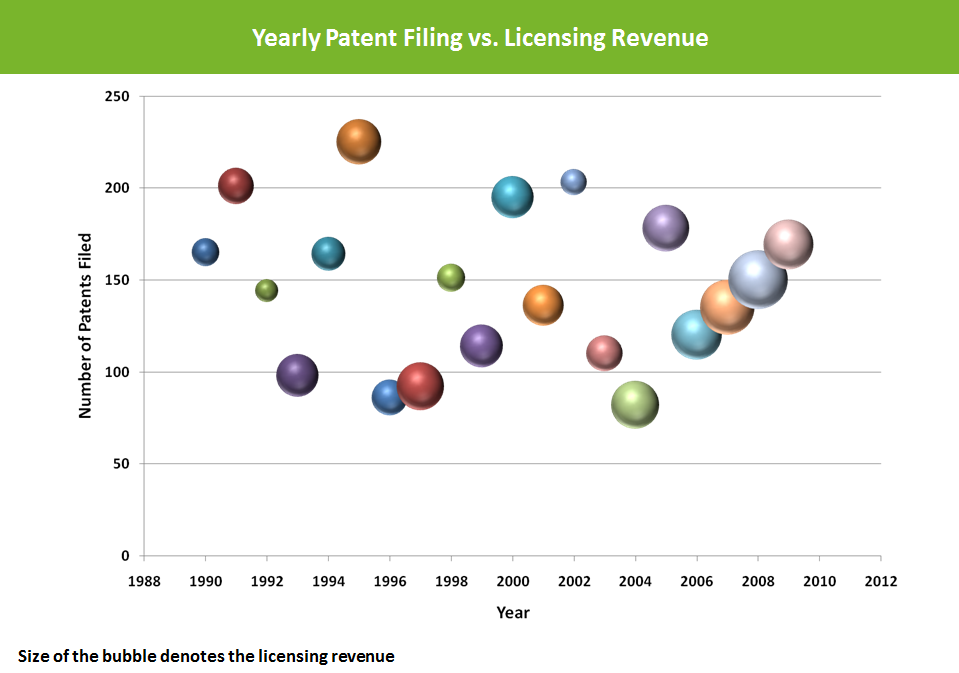
Number of Patents filed vs Licensing revenue
This is another metric that can help understand the value of the organization’s investment if the organization licenses its patent portfolio. This metric is useful if the organization is:
- A technology company, such as Qualcomm, that earns significant revenue from licensing its technology, or
- A University whose objective is to link the success of its intellectual property initiatives with the number of licensing deals.
This metric provides a bird’s eye view of revenue earned per patent. It can be prepared for a specific technology, a specific group of companies, or a specific industry based on the objective and the type of organization.
For instance, in 2013, given its high R&D spending over the past decade, Nokia built a strong patent portfolio comprising 20000+ (16000 issued and 4000 pending) patents. As a result, Nokia generated about $685 million in patent royalties that year.
However, Nokia was way behind Qualcomm in the generation of licensing revenue despite having a strong patent portfolio. That very year, Qualcomm generated $4.5 Billion in licensing revenue. Had Nokia utilized its patents strategically, they could have made much higher than the original amount.
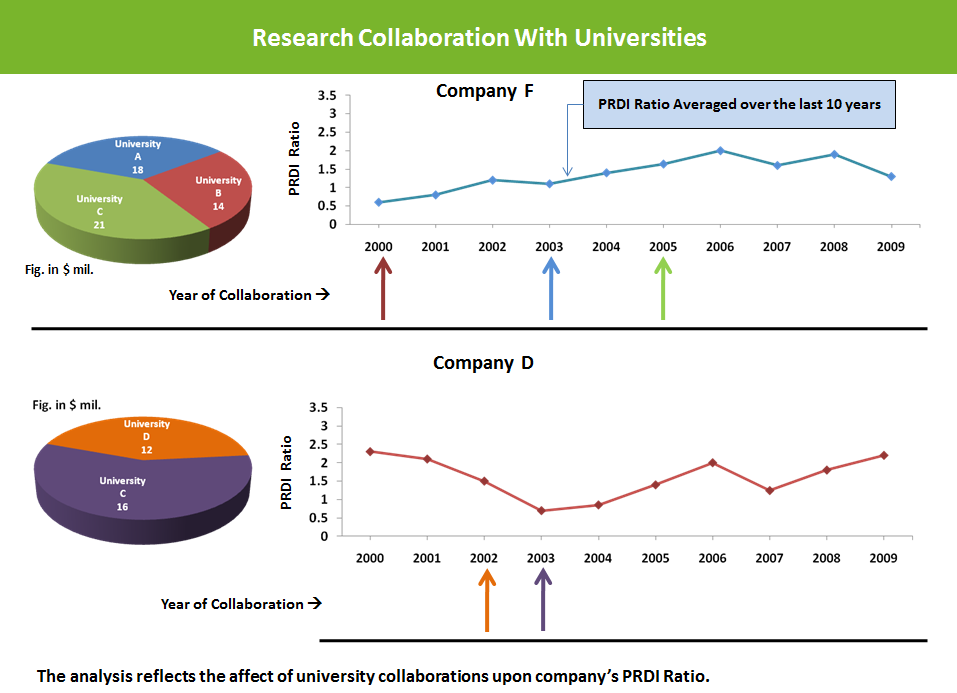
Research Collaboration with Universities
Benchmarking is not just based on intrinsic factors, but also extrinsic. There are a lot of corporations that try to maximize their return by liaising with universities or research institutes. The liaison may be in the form of funding a research work of a professor (more suitable for SMEs) or opening a new lab in the university (suitable for large size corporations).
Research collaboration with universities is highly advantageous as it can help corporations improve their PRDI ratio or get higher returns on their investment with reduced risk.
For example, in the below chart, after the company F collaborated with university B in the year 2000, with university A in 2003 and with university C in 2005, their PRDI ratio improved as a result of the collaboration.
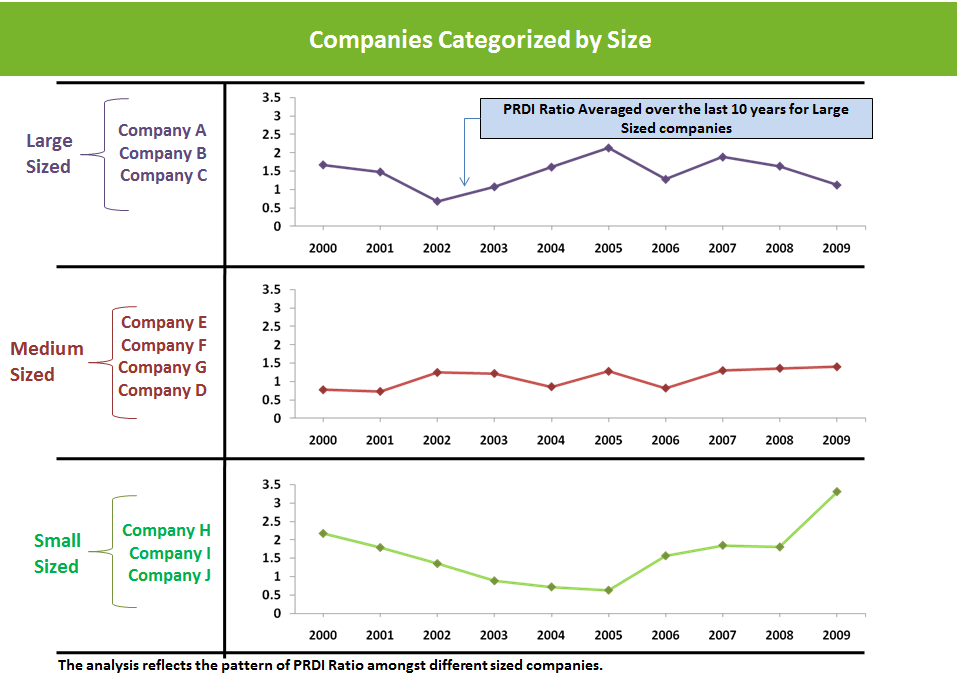
Age and Size of the Company
Factors like age and size of a company matter in the process of benchmarking. Large and stable companies may have a stable PRDI ratio as compared to new companies that may have unstable ratios with regular fluctuations.
Conclusion:
It is important for the management and IP departments of organizations to perform yearly IP benchmarking. It would not just help ensure that they are ahead of the competition, but also ensure that their IP strategy is in sync with their business strategy.
Relevant Read: Smart Patent Prosecution: 5 Type of Patent Examiners You Should Know!